
DLG GROUP · INSIGHTS / SOLAR & HOME PERFORMANCE
Solar & storage.
Built around the home.
Start with the home’s demand, roof and operating goals. Then compare panels, storage and heat-pump integration.
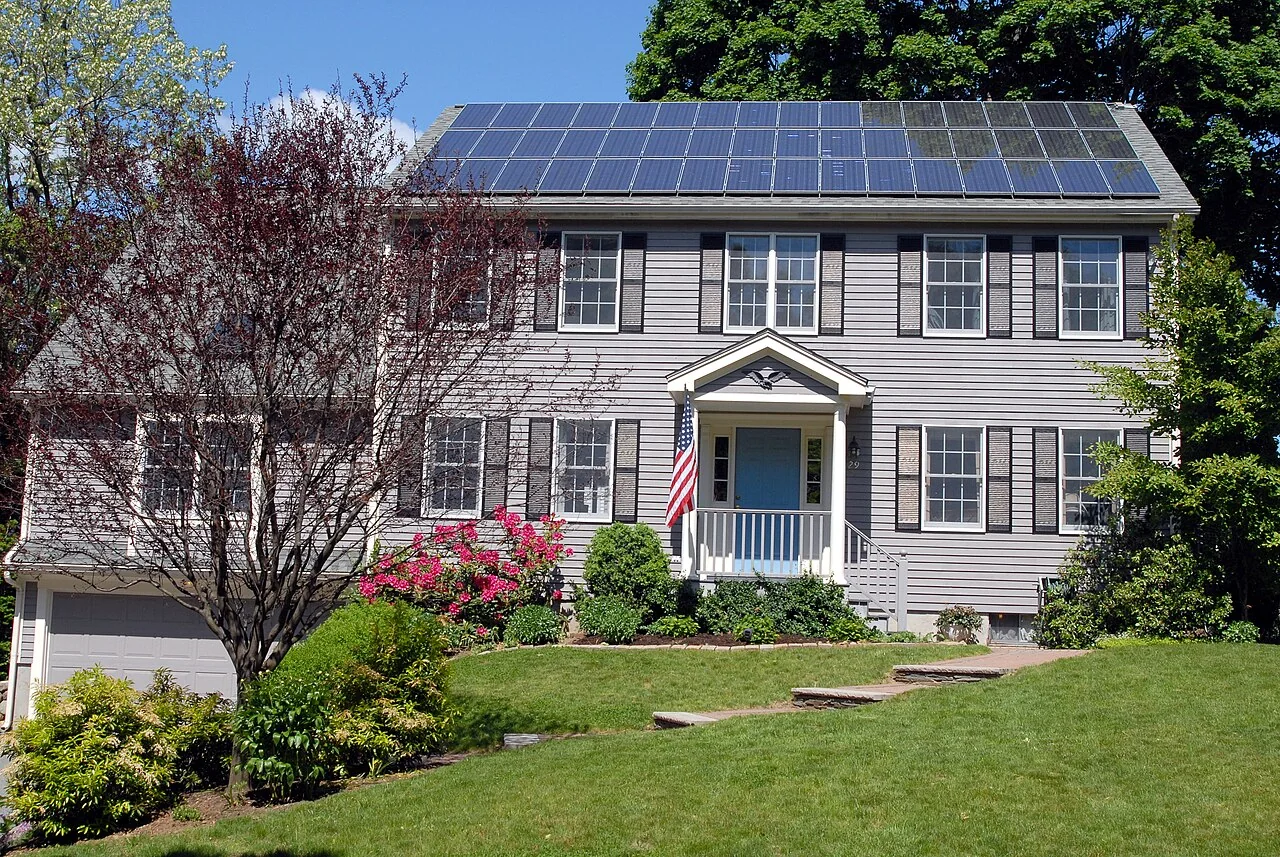
The useful starting point.
- Demand: collect twelve months of electricity use and note planned EV or heat-pump loads.
- Building: establish roof condition, shade, space and the approval route.
- Operation: decide whether the goal is bill reduction, selected-load backup or a different service.
VISUAL EQUIPMENT BRIEF / NEW
Panel types and the technology behind the label.
Understand silicon, thin-film, TOPCon, HJT, back-contact, bifacial and roof-integrated products. Then compare established U.S. references with newer international announcements and tandem developments.
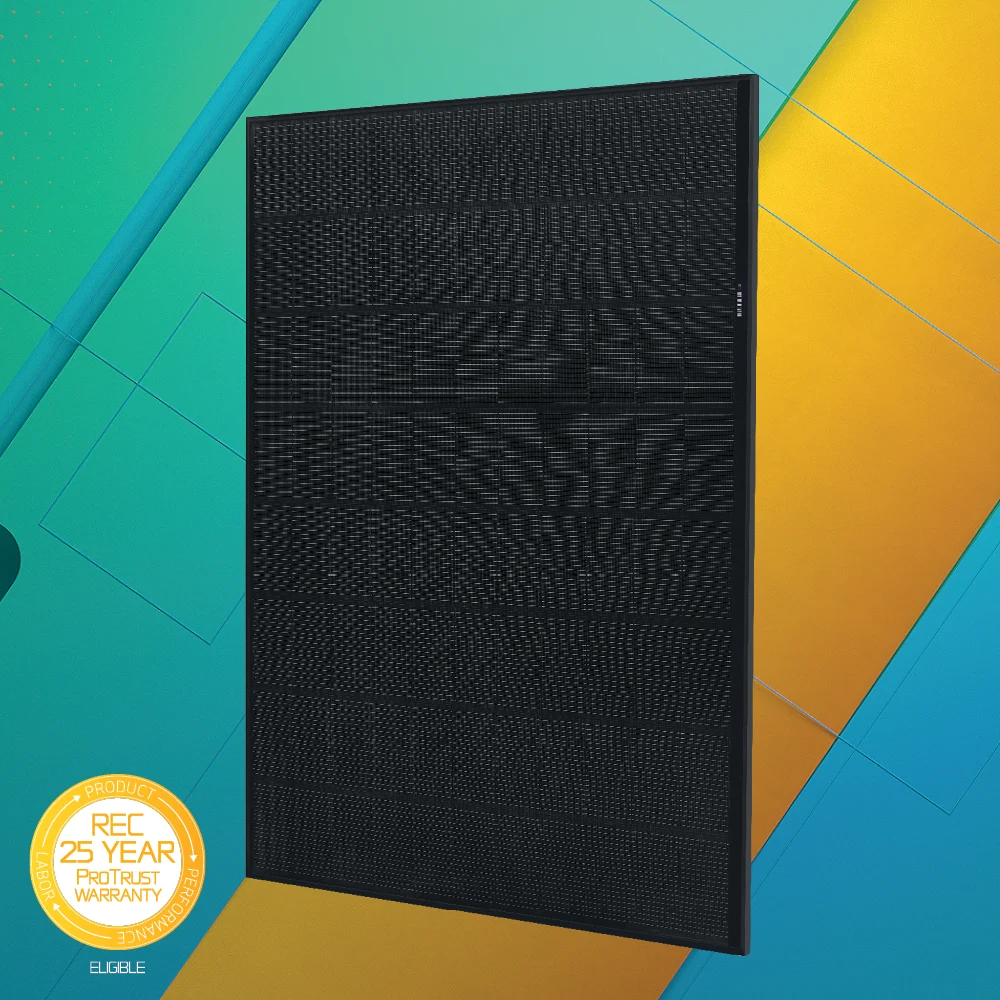 REC / HJT reference
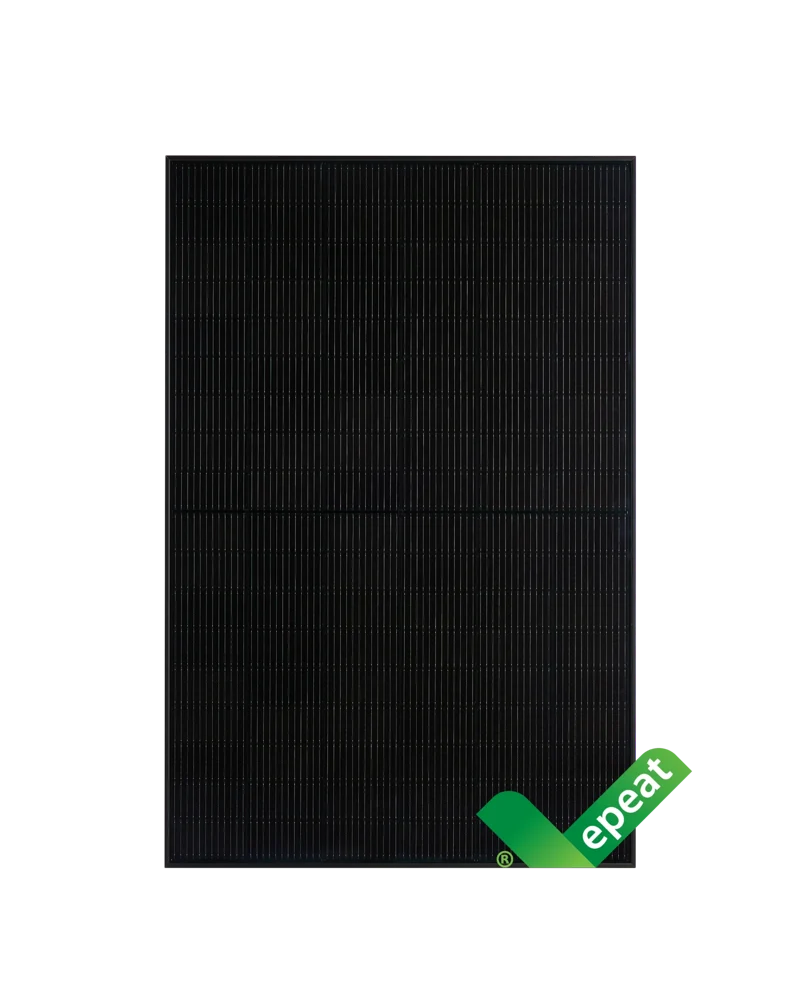 Qcells / n-type reference

Manufacturer images: © REC / Qcells. Product examples, not endorsements.
Read the panel types & technology brief ↗01 / Read the roof and systemChapters 1–5 · Objectives, ratings, roof condition, attachment and equipment roles.
1. Begin with the outcome you need
Write down the purpose before comparing equipment. Reducing purchased electricity, shifting energy to a different time and keeping selected loads running during an outage are different objectives.
| Objective | Information to gather | Question for the proposal |
|---|---|---|
| Reduce electricity purchases | Bills and, where available, interval consumption | How does estimated production align with when the home uses energy? |
| Shift energy use | Consumption timing and the actual tariff | Which control strategy is proposed, and on what assumptions? |
| Support selected loads during outages | The loads, their demand and required operating period | Which loads are actually backed up, and what limits apply? |
| Prepare for future changes | Planned EV charging, heat pump or other major changes | What is included now, and what would need alteration later? |
These are DLG scope questions. DOE’s consumer process guide similarly points to reviewing bills and future changes when considering electricity needs. [S01] A future-ready label is more useful when the proposal states exactly what can be added and what would need replacement.
2. Separate capacity, production and consumption
Power describes a rate. Energy describes an amount over time. EIA distinguishes storage power capacity from energy capacity using watts and watt-hours respectively. [S02]
In a proposal, keep these items separate:
- PV capacity in kW: a rating for the array under stated conditions, often presented as DC capacity.
- Estimated production in kWh: energy the model expects over a period, such as a month or year.
- Home consumption in kWh: energy used during the period being examined.
- Battery usable energy in kWh: the usable amount stated for the selected product and operating conditions.
- Battery output in kW: the power the system can supply under its specified conditions.
A panel rating is not a promise of constant output. An annual production figure does not establish how much power is available at a particular evening or during a cloudy outage.
A simple battery example
If an illustrative system has 6 kWh available to the selected loads and those loads draw a constant 0.5 kW, the ideal arithmetic is 6 ÷ 0.5 = 12 hours. This is a teaching example, not a runtime forecast. Real assessment needs available charge, reserve settings, losses, changing demand, power limits and any solar contribution. DOE notes that storing and recovering energy involves losses. [S03]
3. Read the roof before the panel layout
DOE’s consumer guide includes roof condition and suitability in the planning process. [S01] Ask for the roof type, age/condition record, structural review where required and coordination with any planned roof work.
The drawing should identify the proposed array, relevant roof features, access constraints and cable/service routes. Ask who confirms applicable layout and access requirements for the actual jurisdiction. Aerial imagery is a starting point, not a substitute for the assessment.
| Roof or mounting context | What to establish | Detail to request |
|---|---|---|
| Standing-seam metal roof | Exact seam profile, roof system and proposed attachment | Product compatibility, load path and roof-maker requirements |
| Shingle or tile roof | Roof condition and selected attachment arrangement | The actual mounting and weatherproofing detail |
| Low-slope or membrane roof | Roof assembly and proposed support strategy | How the chosen system addresses loading, water management and maintenance access |
| Ground or carport mounting | Supporting structure, site and route to the building | Site/structural arrangement and the scope of associated work |
This table identifies review subjects. It does not approve one fastening or waterproofing method for every material.
4. Follow the load path and the water-management detail
S-5!’s mounting guidance explains that attachment loads pass through the metal roof panels and their attachment into the building. It also calls for verification of the roof and structure rather than treating clamp strength as the entire assessment. [S04]
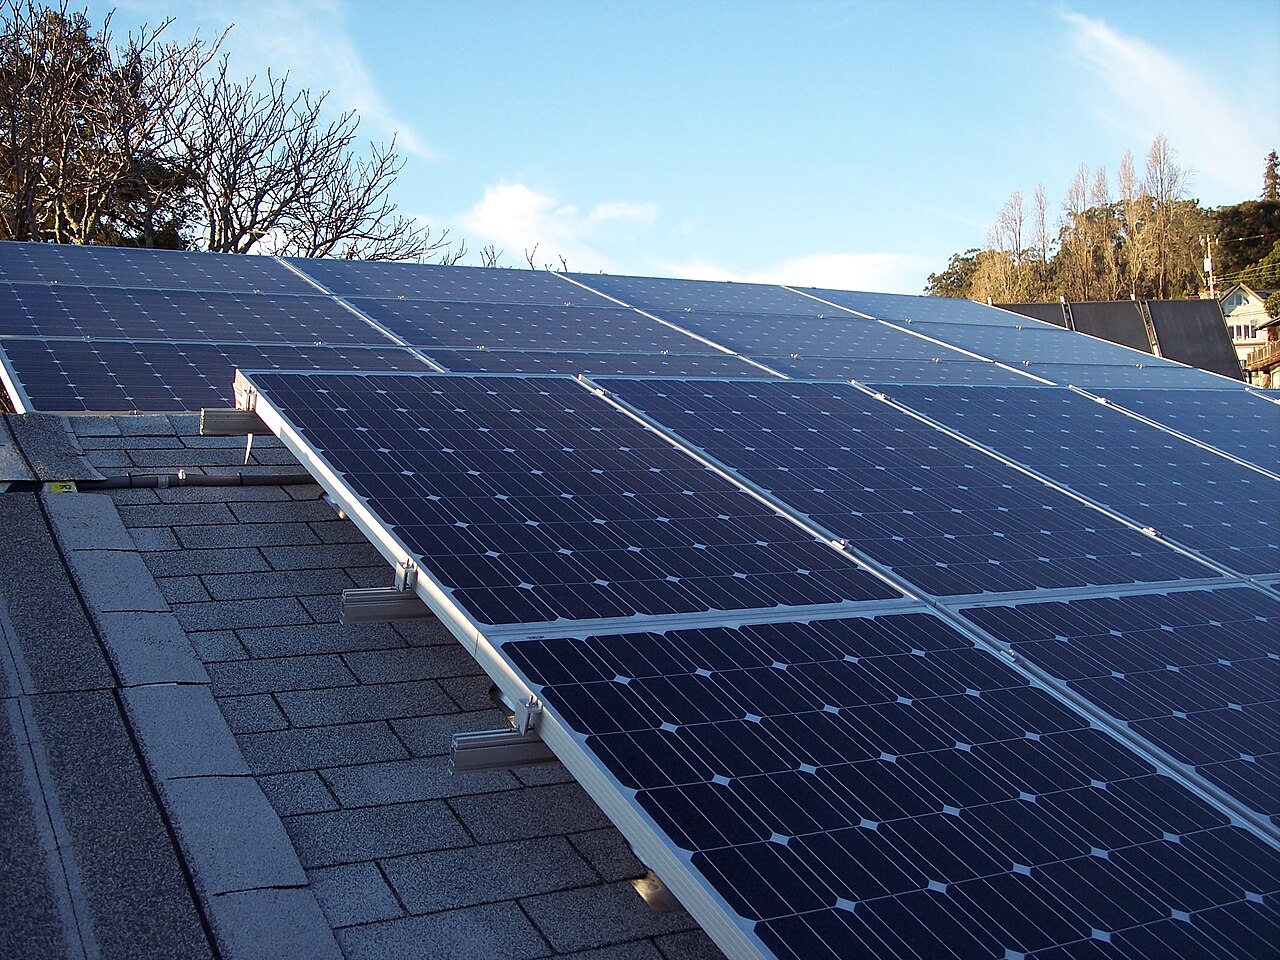
ACTUAL PHOTOGRAPH / REFERENCE
Read the visible roof support
Beneath the modules: a real roof-mounted array with supporting rails visible in Berkeley, California (2011). This photograph shows a shingle roof; the standing-seam concept nearby is a different roof context. The photograph does not verify hidden weatherproofing. Reference only, not a DLG project or a current installation specification.What to ask: how does the proposal address the existing roof, the mounting system and responsibility for roof-related work?Photo: Alfred Twu · Wikimedia Commons · CC0 1.0. No DLG image edits. Source and license checked October 16, 2026.
Closer look: a loose mounting component
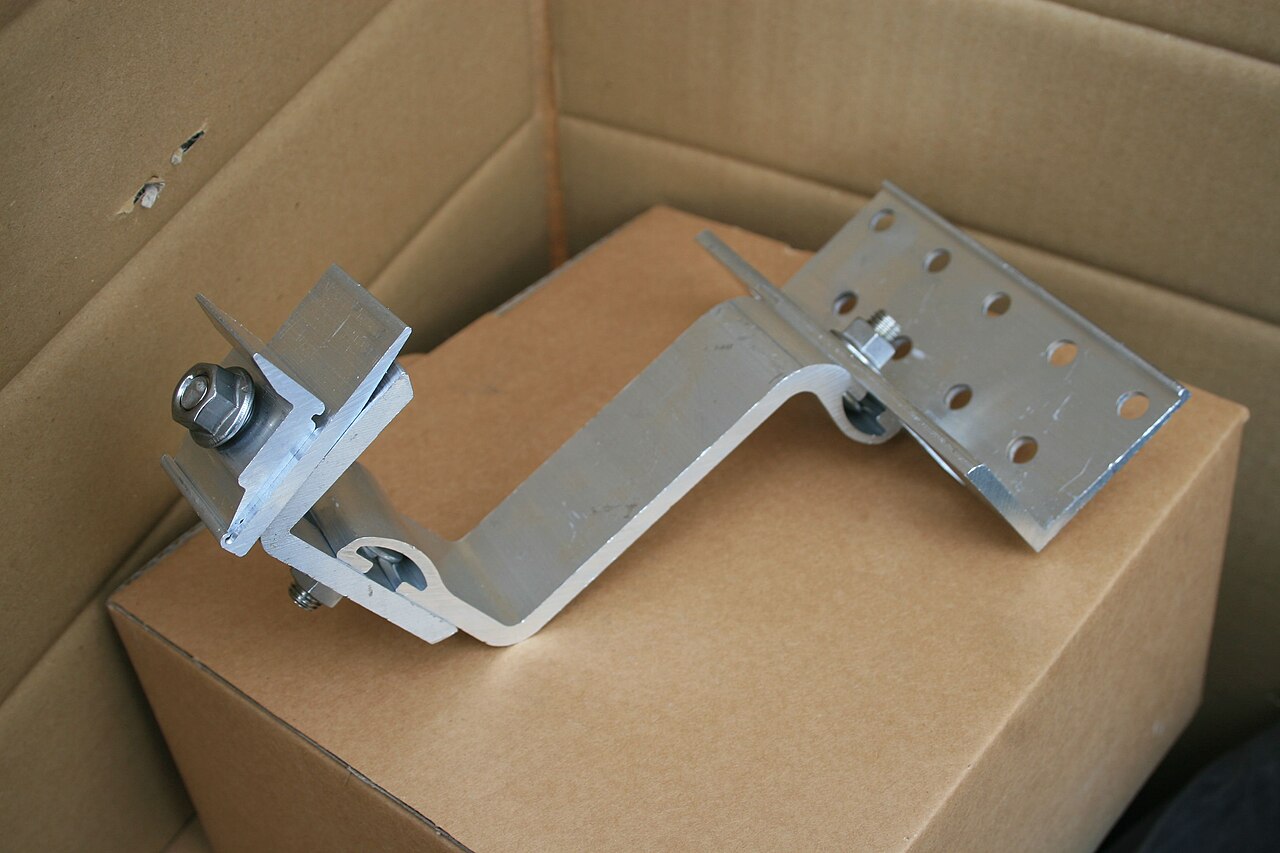
ACTUAL PHOTOGRAPH / REFERENCE
A component before installation
One component, not a complete system: a solar roof bracket photographed in Selm, Germany (2011). It is shown loose, not installed; suitability cannot be established from this image.What to ask: which exact mounting components are proposed, and who confirms their suitability for this roof?Photo: Stefan Thiesen · Wikimedia Commons · CC BY-SA 3.0. No DLG image edits. Source and license checked October 16, 2026.
Closer look: a standing-seam mounting concept
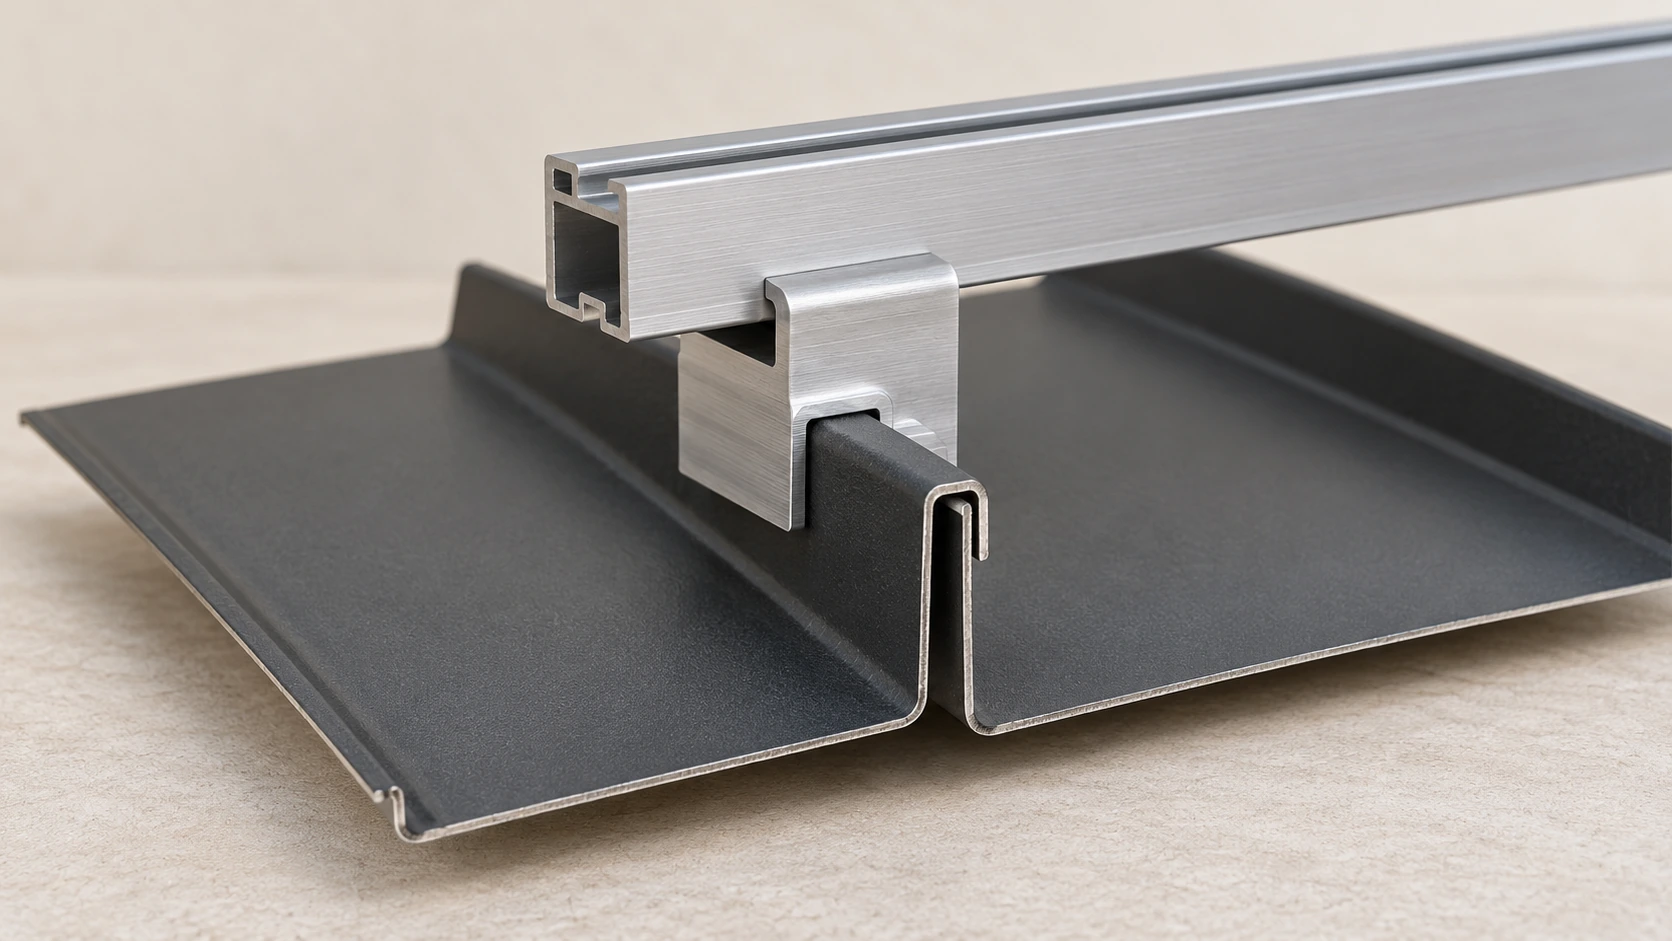
The image introduces a question, not a mounting recipe: which tested attachment matches the exact roof profile, and how are loads transferred to the structure? Obtain the selected product and roof-system details, including any weatherproofing, movement and warranty conditions.
Ask the roof and solar team to coordinate the attachment, roof movement, water management, cable routing and future access. Keep the responsibilities in writing. Do not infer load capacity, fastener torque or a leak-free installation from a visual sample.
5. Understand the system roles
DOE explains that PV produces direct current and an inverter converts it to alternating current for relevant uses. Inverters may also perform monitoring and control functions. [S05]
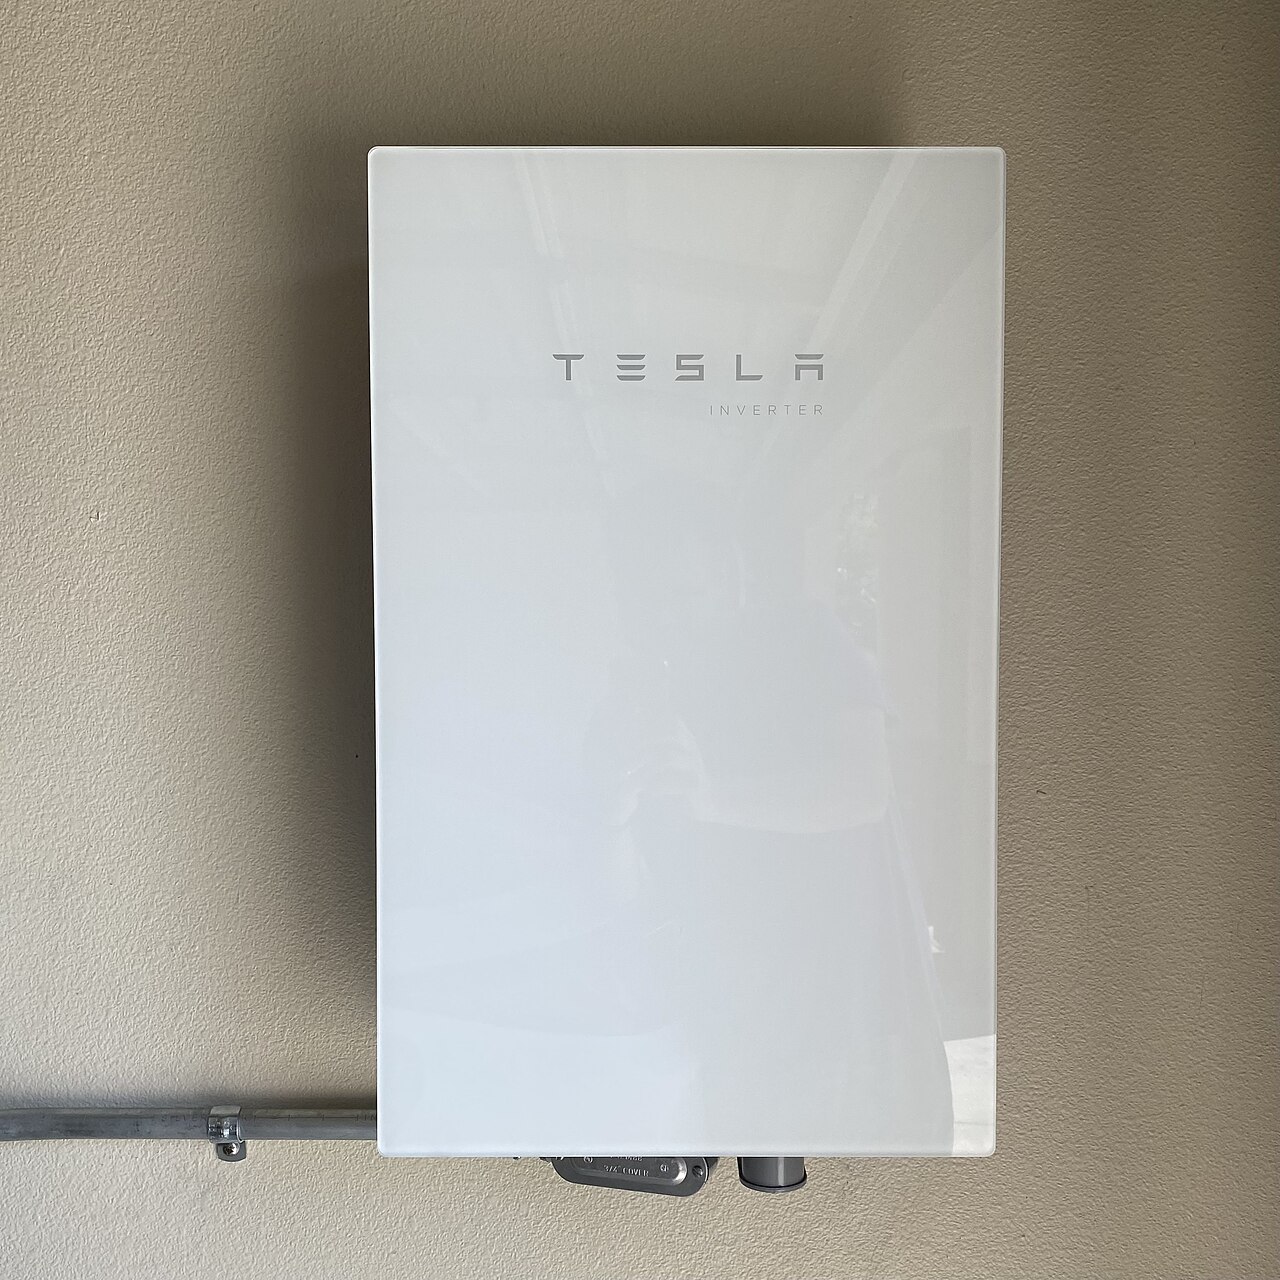
ACTUAL PHOTOGRAPH / REFERENCE
From roof equipment to the garage wall
Beyond the roof: an inverter installed in a home garage. Equipment example only; no product endorsement or installation recommendation.Photo: RickyCourtney · Wikimedia Commons · CC BY-SA 4.0. Reference image, not a DLG project.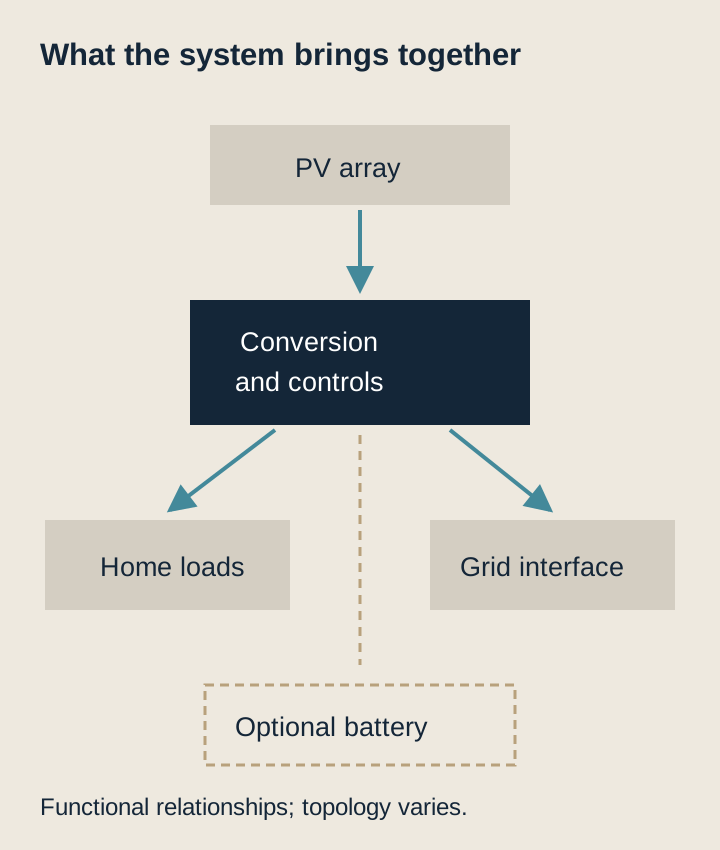
| Component or function | What to confirm |
|---|---|
| PV modules | Exact model, ratings and layout |
| Inverter/power conversion | Exact model, compatibility and operating functions |
| Battery, if included | Usable energy, output, limits and compatible equipment |
| Controls and monitoring | Operating modes, reserve settings, communications and owner access |
| Connection and protection | The documented arrangement, approvals and relevant inspections |
Ask for a system description that shows how the selected products work together. A battery-ready inverter, an app screenshot or a hybrid label does not explain every function included in the actual proposal.
02 / Decide how the home should operateChapters 6–11 · Generation, backup, storage, commercial assumptions and handover.
6. Compare estimated generation with the demand profile
DOE notes that solar output changes with time, season, weather, shadows and other conditions. Storage can help make energy available at a different time from production. [S03]
Request the assumptions behind an estimate: location/weather data, orientation, tilt, system size, shading and losses, together with the model and date. PVWatts provides estimates of grid-connected PV production, and its own cautions explain that results depend on inputs and modelling assumptions. [S06]
An annual total is a useful summary. Also ask for monthly output and, where it informs the decision, a comparison with interval consumption. Distinguish directly used generation, grid imports, exports and any battery charging/discharging in the proposed analysis. This article does not calculate a yield for the concept house shown above.
Useful question: Which assumptions would change most if a nearby tree grows, a roof slope differs from the model or evening consumption increases?
7. Define what happens when the grid fails
Solar, storage & home charging
Follow the power in three situations
One example: a grid-connected home with solar, a battery, and an EV charger. The outage case assumes equipment configured for backup and a selected-load panel. The routes illustrate possibilities, not a dispatch schedule or a wiring plan.
01 / Grid available
Daylight
Solar → Home loads
Solar surplus → Battery, when configured
If the EV is plugged in and charging is enabled, it can use available solar power. The grid can cover any shortfall. Whether excess power goes to the battery or the grid depends on settings and utility arrangements.
02 / Grid available
After dark
Battery → Home, if scheduled
Grid → Home and EV charging
Solar output is absent at night. Battery support depends on charge level, reserve, and settings. In this example, the EV charges from the grid; the installer should confirm whether your battery can or should also supply that load.
03 / Utility power lost
Grid outage
Battery → Backup inverter → Selected circuits
Solar → Backup system, only if supported
Compatible backup equipment isolates the home’s backed-up circuits from the utility. In this example, the EV charger is outside the backup panel, so it is off. Do not assume rooftop solar can operate during a grid outage.
What to ask: Which circuits stay on? Can solar recharge the battery during an outage? What usable battery energy (kWh) and inverter power (kW) are available? Is the EV charger included or intentionally left out?
Read the home EV charging guide · U.S. Department of Energy: solar and resilience · U.S. Department of Energy: home EV charging
DOE explains that typical grid-dependent solar systems switch off when the grid goes down. Outage operation requires a system designed for that purpose; appropriately configured conversion, storage and control functions matter. [S07] Solar on the roof alone is not a backup guarantee.
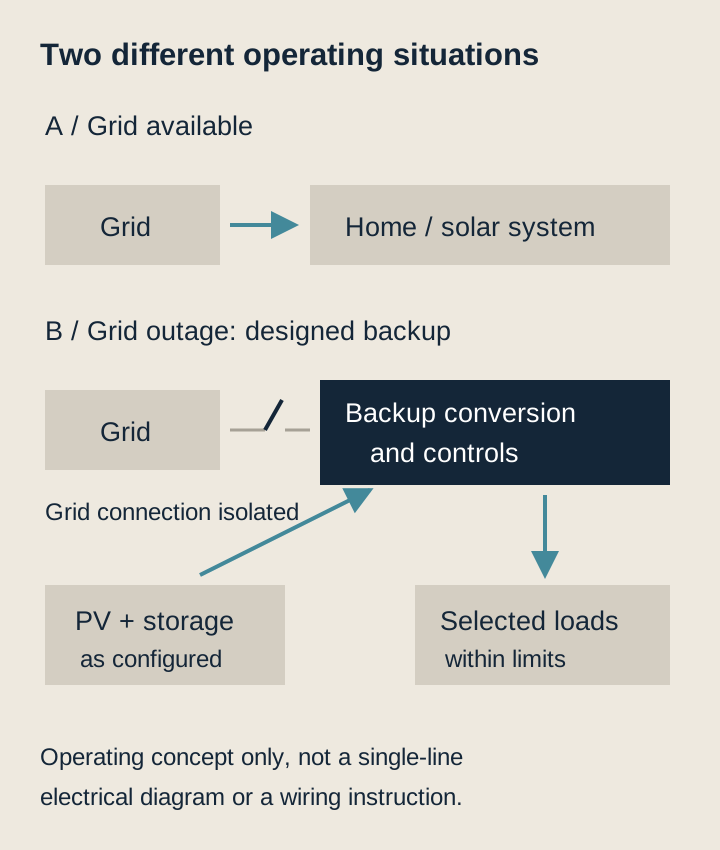
Use a written backup-load schedule. Identify what is included, what is excluded and which loads may need to be managed. Ask separately about continuous demand, starting demand, available charge, reserve settings, solar recharging and behaviour after the battery is depleted.
DOE describes advanced inverter functions as enabling solar-plus-storage operation without grid support when the system is designed to do so. [S05] Request demonstration of the promised behaviour during commissioning, together with the owner instructions. Do not infer whole-home backup from a battery’s energy-capacity number.
8. Review the battery as part of the building
Once a battery product is selected, ask the design team to confirm its location and the installation requirements for the actual equipment and jurisdiction. Record access, environmental limits, associated equipment and the responsible installer. This guide does not prescribe a clearance, fire-resistance assembly or battery location.
| Decision | Evidence to request |
|---|---|
| Operating objective | Intended mode: daily use, tariff shifting, backup reserve or a documented combination |
| Capacity and output | Exact usable-energy and power specifications, with relevant limits |
| Building integration | Approved equipment arrangement and installation requirements |
| Future expansion | Permitted additions, compatibility and scope/cost assumptions |
| Ownership and support | Warranty terms, monitoring access and the service contact |
Keep the battery, inverter, controls and backed-up circuits in the same project conversation. Adding storage later can be a separate scope, not an automatic consequence of having panels installed.
9. Read the commercial assumptions separately
DOE’s homeowner guide links potential savings to electricity use, system production, ownership arrangements, utility rates and compensation for exports. [S08] A production estimate alone does not establish a bill reduction.
Ask the proposal to identify the applicable tariff and export arrangement, the assumptions behind bill calculations and all payments associated with the chosen ownership model. Request a clear distinction between equipment price, installation, financing, subscriptions and ongoing service charges.
Incentives, tax treatment and utility rules need current, project-specific verification. No tax-credit percentage, tariff, payback period or property-value premium is quoted here. Those changing figures should be examined in a separate dated analysis for the actual address and owner.
10. Use review points from survey to handover
DOE’s consumer process guide identifies assessment, design-related decisions, permits and inspections as parts of going solar. [S01] Use the framework below to agree responsibilities and evidence rather than assuming panel installation is the final step.
| Stage | Record or agree | Review point |
|---|---|---|
| Building and demand survey | Roof, consumption and future changes | Confirm the objective and unresolved conditions |
| Coordinated proposal | Layout, equipment, roof details, production and operating assumptions | Compare proposals on the same scope |
| Approvals | Required applications, inspections and connection responsibilities | Identify who obtains and records them |
| Installation | Actual equipment and agreed installation records | Record changes before they become hidden assumptions |
| Commissioning | Monitoring, protection/control functions and any promised outage operation | Demonstrate the included modes |
| Handover | Manuals, warranties, ownership documents and owner account access | Agree service responsibilities and open items |
Do not operate a system on the assumption that physical completion equals every required permission or approval. Ask the installer to identify the applicable steps for that installation.
11. Make monitoring and maintenance usable
Record the installed equipment and ask how the owner will see production, faults and operating status. Agree which alerts need attention and whom to contact. Cleaning and inspection should follow the selected equipment and roof requirements; a generic annual-cleaning promise is not a complete maintenance plan.
For a house already fitted with solar, DOE advises reviewing system age, installer information, warranties, production records and ownership arrangements. [S09] Request the relevant records rather than judging the asset only from a roof photograph.
Questions to take to the installer
- Which household objective is this proposal designed to meet?
- What roof assessment and mounting detail support the layout?
- Which model inputs underpin the production estimate?
- How do the modules, inverter, battery and controls work together?
- What is the exact outage scope, if included?
- Which approvals and commissioning records will be provided?
- What charges, ownership terms and ongoing responsibilities apply?
- How will access, monitoring and support be handed over?
03 / Work through the home exampleChapters 12–15 · 900 kWh/month scenario, budget, permissions and Solar Explorer.
12. Worked example: a home using 900 kWh per month
Location frame: Fairfax County, Virginia, USA. This is a DLG teaching scenario for an existing detached home, not a surveyed property, a national household average or an installer quotation. The house remains grid-connected. Dominion’s process below applies only if Dominion is the actual electricity supplier. Local rules elsewhere must be researched separately.
What does “how many kW does a home use?” mean?
Start with 12 months of bills in kWh. In this example, 900 kWh/month × 12 = 10,800 kWh/year, or approximately 29.6 kWh/day over 365 days. Dividing by 8,760 hours gives an average demand of 1.23 kW. This does not mean the home only needs a 1.23 kW inverter: simultaneous heating, cooking, water heating or EV charging can require much more. Use interval data and a load assessment to establish actual peaks and starting loads.
| Planning item | Illustrative selection or calculation | Meaning and limitation |
|---|---|---|
| Annual consumption | 10,800 kWh | Assumed bill total; replace with the property’s records |
| PV modules | 20 × 450 W | 9.0 kWp DC; the module rating is not constant output |
| Module face area | Assume 1.80 × 1.15 m each; 20 × 2.07 = 41.4 m² | Assumed dimensions, not a selected product datasheet |
| Roof planning allowance | Approximately 50–60 m² of suitable roof | DLG space allowance for this example; not a code setback or a guaranteed fit. Geometry, access, obstructions and shading may require more |
| Inverter | Quote a compatible roughly 7.6–9 kW AC class solution | Illustrative coordination range; exact DC/AC ratio, service connection and backup output require design |
| Storage | One 13.5 kWh-class battery system | For the runtime exercise below, assume 13.5 kWh usable before reserve; verify the selected product’s usable rating |
| Backup scope | Selected essential circuits | Whole-home heating, cooking and vehicle charging are not assumed included |
How much might the panels generate?
The calculation is annual energy = array kWp × annual specific yield. Use the following sensitivity exercise to understand the sizing. The yields are deliberately chosen assumptions, not a Fairfax PVWatts result or a predicted production range.
| Assumed net AC yield per kWp per year | 9 kWp annual energy | Ratio to 10,800 kWh consumption |
|---|---|---|
| 1,000 kWh/kWp | 9,000 kWh | 83% |
| 1,200 kWh/kWp | 10,800 kWh | 100% |
| 1,400 kWh/kWp | 12,600 kWh | 117% |
“100% annually” does not mean continuous self-sufficiency or a zero bill. Night-time imports, exports, seasonal differences, tariff rules and battery losses still matter. Before using a figure in a proposal, replace this exercise with a site-specific model recording weather/location, orientation, tilt, shading, inverter sizing and losses. [S06]
What could the battery keep running?
For arithmetic only, assume 13.5 kWh usable, initially full; retain a 20% reserve and allow an illustrative 10% delivery loss: 13.5 × 0.80 × 0.90 = 9.72 kWh delivered. These are independent teaching assumptions, not product specifications. If the chosen product’s stated usable energy already includes conversion losses, do not subtract those losses again.
| Assumed average backed-up load | Illustrative operating time without solar recharge |
|---|---|
| 0.5 kW | 19.4 hours |
| 1.0 kW | 9.7 hours |
| 2.0 kW | 4.9 hours |
These are energy calculations, not runtime guarantees. Check battery/inverter continuous output, surge capability, initial charge, temperature and actual circuit behaviour separately. A 13.5 kWh battery does not automatically provide 13.5 kW. The equipment position needs a dimensioned layout based on the actual battery and applicable fire/building requirements; no universal wall clearance or footprint is assumed here.
What the cabling price should cover
Ask the installer to show routes on the coordinated plan and identify what the turnkey price includes. This is a quotation checklist, not a wiring instruction.
| Cable or electrical work | Scope to make visible in the quotation |
|---|---|
| Roof array connections | Module interconnections and the selected DC string/optimizer or AC microinverter arrangement |
| Route into the building | Measured route, suitable cable/conduit, penetrations, weather sealing and accessible support |
| Inverter to connection point | AC route, protection, disconnecting arrangement and service/panel compatibility |
| Grounding and bonding | Array, mounting and equipment requirements coordinated with the electrical design |
| Battery and backup | Approved interconnects, transfer/islanding controls and any essential-loads subpanel |
| Communications | Monitoring gateway, networking and owner access |
| Completion records | Circuit labels, as-built routes and commissioning documentation |
Do not select conductor sizes or breaker ratings from panel count alone. Route length, current, voltage, temperature, grouping, voltage drop and the chosen equipment all affect the design. Longer trenching, panel replacement or a service upgrade should be priced as explicit exceptions. Standard cabling must not be charged twice by adding a generic cable allowance to an already inclusive turnkey quote.
13. A transparent budget for the same example
USD, checked 19 October 2026; gross installed planning figures before incentives and financing. EnergySage’s October Virginia marketplace benchmark is about $2.55/W installed. Applying it to 9,000 W gives approximately $22,950; its own 9 kW table is about $22,930 because the displayed per-watt value is rounded. This is a market reference, not a Fairfax offer. [S10]
| Budget line | DLG example allowance | Requested scope |
|---|---|---|
| 9 kWp solar installation | $20,000–$27,000 | Panels, mounting, inverter, ordinary wiring/labour and permit administration; confirm actual fees and inclusions |
| 13.5 kWh-class storage addition | $13,000–$18,000 | Installed battery and agreed backup integration; check gateway/subpanel and inverter overlap |
| Combined planning total | $33,000–$45,000 | Sum of the two allowances, not a statistical confidence interval |
| Property-dependent work | Separate priced items | Roof renewal, structural repairs, service upgrade, exceptional trenching, relocation or special access |
The allowances are DLG editorial budgeting assumptions centred on marketplace references, not published local price ranges. EnergySage’s national battery benchmark is approximately $15,647 installed for 13.5 kWh, dated August 2026; it is not a Virginia-specific quotation. [S11] For a combined hybrid system, reconcile shared inverter, controls and labour so that adding two quotes does not duplicate equipment. Obtain comparable written scopes before treating the budget as project cost.
No automatic 30% federal homeowner discount has been deducted. IRS states that the Section 25D residential credit is unavailable for property placed in service after 31 December 2025. [S12] Check any current state, local or utility scheme separately; its availability is not assumed. Financing charges, ongoing servicing, insurance implications and future replacement costs are also outside the example. No payback period is calculated without the actual tariff, export treatment and operating assumptions.
14. Applications, documents and permission to operate
Fairfax County is distinct from the independent City of Fairfax. Confirm the parcel’s actual authority, building classification and utility before following this example. Apartment/condominium projects may use commercial rather than residential permit pathways. Ownership, condominium or HOA permissions must be checked against the specific property; owning a unit does not establish exclusive control of a shared roof.
County permit file: Fairfax residential solar
The county’s SOLARR page requires a residential solar permit for roof and freestanding residential arrays, applied for through PLUS. Related electrical equipment is entered in that record; extra work such as a service heavy-up can require a separate electrical record. [S13]
Prepare the following, with applicability confirmed for the project:
- Fairfax Coversheet and architectural/structural drawings.
- House location plat or grading-plan reference, as applicable.
- Permit Authorization when the applicant’s role requires it.
- Property Ownership Affidavit if ownership differs from tax records.
- License Exemption Affidavit if no licensed contractor is listed.
- Additional town approvals where applicable, including Clifton or Vienna.
The county can request corrections and supporting records. Approved plans/permit follow review and fee payment; required construction inspections follow installation stages. [S13] Have the designer establish how battery installation, fire review and any additional electrical work are covered; do not assume the array approval resolves every storage requirement.
Utility file: Dominion-served Virginia example
Keep the county application and utility connection application as two tracked workstreams. Dominion’s NMIN portal guide requests account/customer details, installation address, generator and inverter information, DC/AC capacity and whether battery backup is included. Vendor/customer signatures precede contingent approval. Following installation, the inspection/electrician record is submitted; meter work and billing setup precede the Permission to Operate (PTO) notice. Follow the actual approval conditions before construction and operation. [S14]
A practical owner handover folder
This is DLG’s recommended record set, not a claim that each item is a mandatory upload for every application:
| Record | Why retain it |
|---|---|
| Twelve-month bills and interval data | Explain the original sizing and future comparisons |
| Ownership/roof-use permission and contractor details | Establish authority, responsibilities and contacts |
| Approved layout, structural evidence, electrical single-line and equipment data | Identify what was approved and installed |
| Permit numbers, approved plans and final inspections | Track county completion |
| Signed utility application, connection conditions and PTO | Establish the permitted operating status |
| As-built drawings, commissioning and demonstrated backup scope | Explain actual operation and limitations |
| Warranties, monitoring credentials and maintenance contacts | Make the system usable and transferable with the property |
Physical installation, a passed county inspection and utility PTO are different milestones. Assign a named responsible party to each record and do not treat the installer saying “finished” as the operating permission.
Related topic: small wind on homes and other properties
Small wind deserves a separate assessment of wind at rotor height, surrounding obstacles, support structure, noise, setbacks, certified performance and maintenance. Start with the companion Small wind for homes and property guide; a roof that is suitable for solar is not automatically a useful wind site.
15. Solar Explorer: location, roof planes and time
Full preparation version 1.0 extends this guide with a working preliminary-assessment module. Choose a state and county/city, a ZIP/Census ZCTA reference or coordinates. Enter the panel rating/count, direction and tilt for one or two roof planes, then calculate the official model scenario.
The included geography contains 50 states, DC and Puerto Rico; 35,585 county/place entries; and 33,791 ZCTA points, from the 2026 Census Gazetteer. These representative points are not roof measurements or area-wide averages. Postal ZIPs and Census ZCTAs differ; an unmatched postal code needs a different location method. Actual climate-data coverage is checked by the model. [S15]
What the module shows
| Input or result | Available in version 1.0 | How to read it |
|---|---|---|
| Location | State/county/city, ZCTA or coordinates | The chosen point and weather cell remain visible |
| System | Panel W/count, true azimuth, tilt, roof/open-rack mounting, losses and DC/AC ratio | Editable planning inputs, not a selected installation design |
| Multiple roof faces | One or two independently modelled planes | Separate inverter allocations; not a shared-inverter/clipping design |
| Energy | Annual/monthly AC output and monthly-mean hourly power | Typical-year model, not live weather or a forecast |
| Sun path | Compass, hour markers, month/hour selection and geometric daylight | Approximate geometry for the 21st of the month, separately from TMY output |
| Orientation comparison | East/south/west for plane A, other inputs fixed | Plane B stays fixed when enabled |
| Household demand | Monthly average or twelve separate totals | Annual energy coverage is not simultaneous self-supply or a zero bill |
| Space | Module face area and an editable planning allowance | Real roof geometry, access and obstructions still need a layout |
| Battery | Selected-load energy/duration arithmetic | No battery dispatch or whole-home power guarantee |
| Cost | Entered installed solar/battery quotes and other works | No automatic local price, incentive or payback claim |
| Records | Scenario/result JSON, monthly CSV and print review | Retain the assumptions and source records with the comparison |
Actual model references are included
Twelve official model responses are retained for review, including the earlier three approximate urban points/directions, the Census Fairfax County starting point and two 4.5 kWp split-plane examples. The Fairfax County point at 38.82952, −77.27325, with 9 kWp, south 180°, tilt 30°, fixed roof, standard module, assumed losses 14%, DC/AC 1.2 and inverter efficiency 96%, returned approximately 12,362 kWh AC/year. [S15]
That differs from the earlier Fairfax-area point because the input point and climate cell differ. Neither is a prediction for every house in the county. The section 12 sensitivity table remains a separate hypothetical exercise. New system inputs request a fresh model; existing output is not scaled to pretend that a different roof/inverter has been simulated.
Evidence and operating scope
Model version, weather cell/file, climate vintage, standard time offset and input assumptions accompany each completed result. When inputs change, the previous production result remains explicitly identified until a new calculation succeeds. Coverage errors, quota limits, incomplete results and timeouts do not silently replace it with an invented estimate.
This tool includes cached reference models. New online scenarios use a public demonstration connection and depend on service availability. A dedicated server-side model connection is not configured. Reference examples are not live measurements or property-specific installation forecasts.
04 / Follow the energy and connect HVACChapters 16–19 · Day cycle, battery reference, proposal worksheet and heat-pump integration.
16. Follow one day through the system
Watch the home from daylight to night · 10 seconds
Read the separate hourly example below for the numerical energy balance. For location, orientation and roof-plane scenarios, open Solar Explorer.
Annual solar coverage hides an important buying decision: when must the house import power, and when does it export? A home can produce more than it consumes over a day and still buy electricity overnight. To see the mechanism, use the following deliberately fictional hourly example alongside—not in place of—the location-based Solar Explorer.
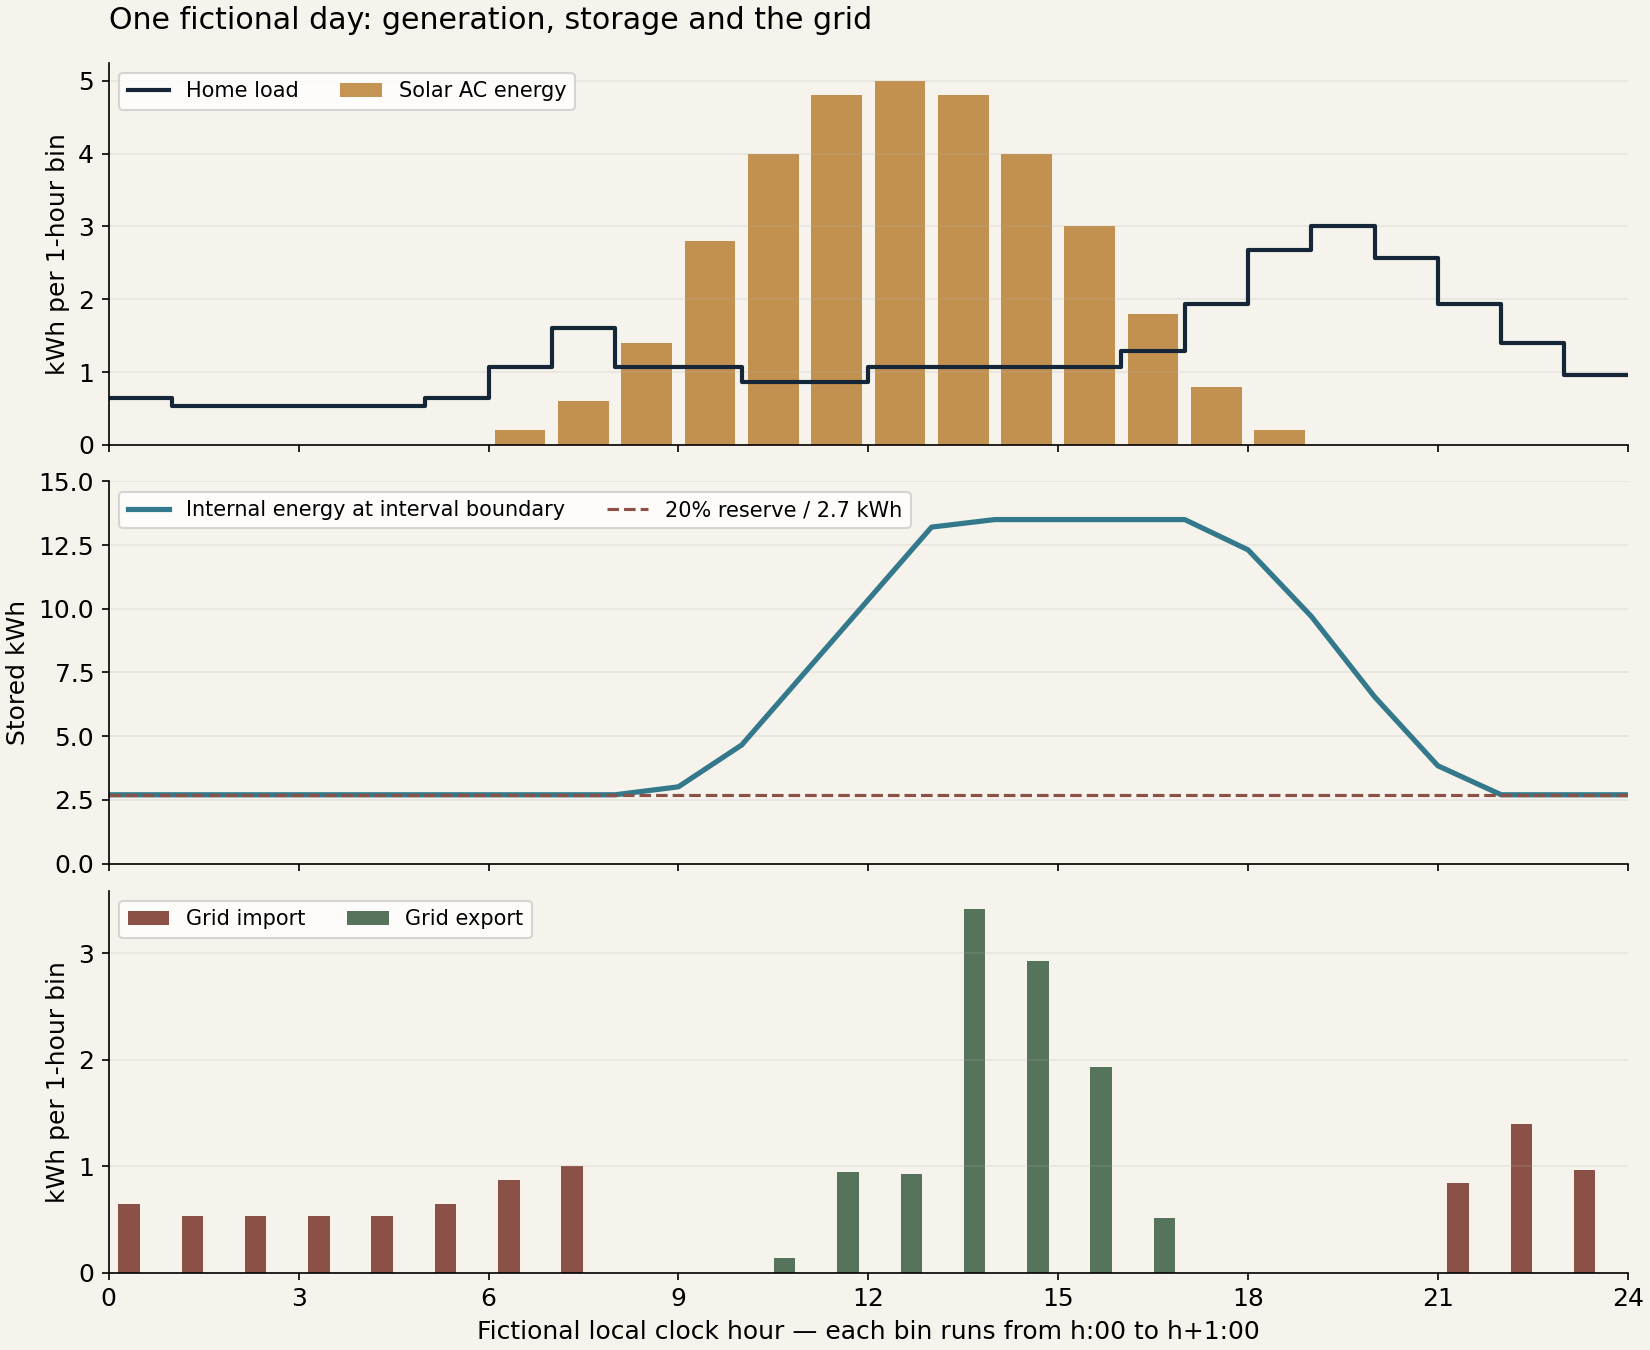
The input load totals 30.00 kWh; solar delivered to the AC comparison bus totals 33.40 kWh. For the battery we assume an internal 13.5 kWh energy store, a 20% minimum reserve, separate 95% charge and discharge efficiencies, and a 3 kW limit in each direction. It begins at reserve; grid charging is disabled. Each interval is one hour. These are teaching assumptions, not Powerwall specifications; the preceding product-class example and this internal energy model use different energy boundaries. Do not apply these efficiencies again to an already AC-delivered manufacturer capacity.
| Daily energy item | Solar without storage | Same fictional day with storage |
|---|---|---|
| Home consumption | 30.00 kWh | 30.00 kWh |
| Solar AC input | 33.40 kWh | 33.40 kWh |
| Solar used directly by the home | 11.23 kWh | 11.23 kWh |
| Grid imports | 18.77 kWh | 8.51 kWh |
| Grid exports | 22.17 kWh | 10.80 kWh |
| AC energy sent into charging | — | 11.37 kWh |
| AC energy returned from discharge | — | 10.26 kWh |
| Modelled battery conversion losses | — | 1.11 kWh |
| Internal energy, beginning / end | — | 2.70 / 2.70 kWh |
The balance closes: 33.40 solar + 8.51 imports = 30.00 load + 10.80 exports + 1.11 losses, subject to rounding. With initial and final stored energy equal, this example does not hide borrowing from a pre-filled battery. Grid imports remain because early demand arrives before the battery has charged and later demand can exhaust the usable window.
Keeping the same profiles and raising reserve to 50% increases imports to 12.36 kWh; reserving 100% leaves 18.77 kWh of imports because no energy is available for shifting. A larger emergency reserve can reduce daily shifting; the preferable balance depends on the owner’s outage objective and actual operating controls. This exercise excludes standby consumption, ageing, temperature effects, forecast dispatch and sub-hourly peaks. Do not multiply this day by 365, describe it as Fairfax weather or calculate a payback from it. The full package includes hourly CSV inputs/results, a reproducible calculation and boundary checks.
Inspect one hour of the same fictional day
All three chart panels use the existing 24-hour calculation above. Solar, home demand and grid bars show energy in each one-hour interval. Stored-energy points sit at the interval boundaries: the point at 13:00 is the result after 12:00–13:00, not the start of that hour.
12:00–13:00: values from the fictional example.
- Solar AC input
- 5.00 kWh
- Home load
- 1.07 kWh
- Solar used directly
- 1.07 kWh
- AC energy into charging
- 3.00 kWh
- AC energy returned by discharge
- 0.00 kWh
- Grid import
- 0.00 kWh
- Grid export
- 0.93 kWh
- Battery conversion loss
- 0.15 kWh
- Internal stored energy at start
- 10.35 kWh
- Internal stored energy at end
- 13.20 kWh
Read the energy entering and leaving the interval together with the change in stored energy.
These are kWh quantities. In a one-hour bin their numerical values also equal the average kW over that hour; they do not reveal an appliance starting surge or a sub-hourly peak. The 3 kW battery limit is an assumed interval-average model limit, not a product surge rating.
Read all 24 intervals or open the calculation data
| Interval | Solar kWh | Load kWh | Import kWh | Export kWh | End stored kWh |
|---|---|---|---|---|---|
| 00–01 | 0.00 | 0.64 | 0.64 | 0.00 | 2.70 |
| 01–02 | 0.00 | 0.54 | 0.54 | 0.00 | 2.70 |
| 02–03 | 0.00 | 0.54 | 0.54 | 0.00 | 2.70 |
| 03–04 | 0.00 | 0.54 | 0.54 | 0.00 | 2.70 |
| 04–05 | 0.00 | 0.54 | 0.54 | 0.00 | 2.70 |
| 05–06 | 0.00 | 0.64 | 0.64 | 0.00 | 2.70 |
| 06–07 | 0.20 | 1.07 | 0.87 | 0.00 | 2.70 |
| 07–08 | 0.60 | 1.61 | 1.01 | 0.00 | 2.70 |
| 08–09 | 1.40 | 1.07 | 0.00 | 0.00 | 3.01 |
| 09–10 | 2.80 | 1.07 | 0.00 | 0.00 | 4.65 |
| 10–11 | 4.00 | 0.86 | 0.00 | 0.14 | 7.50 |
| 11–12 | 4.80 | 0.86 | 0.00 | 0.94 | 10.35 |
| 12–13 | 5.00 | 1.07 | 0.00 | 0.93 | 13.20 |
| 13–14 | 4.80 | 1.07 | 0.00 | 3.42 | 13.50 |
| 14–15 | 4.00 | 1.07 | 0.00 | 2.93 | 13.50 |
| 15–16 | 3.00 | 1.07 | 0.00 | 1.93 | 13.50 |
| 16–17 | 1.80 | 1.29 | 0.00 | 0.51 | 13.50 |
| 17–18 | 0.80 | 1.93 | 0.00 | 0.00 | 12.31 |
| 18–19 | 0.20 | 2.68 | 0.00 | 0.00 | 9.70 |
| 19–20 | 0.00 | 3.00 | 0.00 | 0.00 | 6.55 |
| 20–21 | 0.00 | 2.57 | 0.00 | 0.00 | 3.84 |
| 21–22 | 0.00 | 1.93 | 0.85 | 0.00 | 2.70 |
| 22–23 | 0.00 | 1.39 | 1.39 | 0.00 | 2.70 |
| 23–24 | 0.00 | 0.96 | 0.96 | 0.00 | 2.70 |
Display values are rounded to two decimals; the calculation keeps full precision. Download the full hourly CSV · Open the full chart.
What to ask your installer: request an interval profile showing solar, load, storage, imports, exports, reserve, losses and matching start/end energy. Identify weather/load inputs and operating rules. A daily total alone cannot tell you which hours remain dependent on the grid. This teaching example has no regional weather, seasonal, outage or bill prediction.
Turn energy flows into an honest bill comparison
For a simplified, explicitly hypothetical tariff, suppose imported energy costs $0.20/kWh and exported energy earns $0.05/kWh, without fixed charges or time bands. The example’s energy-only amount would be 18.77143 × $0.20 − 22.17143 × $0.05 = $2.65 without storage, and 8.51143 × $0.20 − 10.80301 × $0.05 = $1.16 with storage. The difference is approximately $1.48 for this invented day, calculated before rounding. This is arithmetic, not a real utility tariff or annual saving. Changing export compensation can substantially change the result; equal import/export rates can make battery losses costly. Demand charges, time-of-use periods, minimum bills, financing and battery wear require their own model.
17. Read an actual battery datasheet in layers
One reference—not a recommendation—is the U.S. Tesla Powerwall 3, model family 1707000-xx-y, 2025 datasheet retrieved 20 October 2026. Its table states 13.5 kWh AC nominal energy, with 5.8 / 7.6 / 10 / 11.5 kW nominal output configurations. The energy footnote specifies beginning of life, 25°C and 3.3 kW charging/discharging. Therefore “13.5 kWh” and “11.5 kW” answer different questions, and the quotation must identify the configured rating. The document lists integrated solar input and compatible islanding equipment; an energy expansion is not automatically extra inverter output. [S16]
For a separate, hypothetical load schedule, 3 kW of priority loads + 4 kW HVAC + 7 kW EV charging = 14 kW simultaneous demand. That exceeds an 11.5 kW comparison limit even if sufficient energy remains. Deferring the EV leaves 7 kW in this arithmetic, but motor starting, phases, actual backup rating, temperature and the approved configuration still need checking. Neither the sum nor a marketing phrase establishes that the selected home can be backed up.
AC coupling and DC coupling: compare the whole arrangement
| Quotation question | Separate PV inverter with AC-coupled storage | PV connected through a compatible hybrid arrangement |
|---|---|---|
| Existing equipment | Which existing PV equipment remains compatible? | Which existing equipment must be replaced or bypassed? |
| Conversion path | Identify PV DC→AC and battery charge/discharge conversion boundaries | Identify the shared conversion path and actual operating modes |
| Outage operation | Demonstrate that PV can operate with the selected islanding and battery controls | Demonstrate PV operation, restart and load behaviour for this exact configuration |
| Capacity constraint | Record separate inverter and interconnection limits | Record shared inverter/output constraints; do not add DC nameplate ratings as AC output |
| Cost comparison | Separate retained equipment, new storage, interface and commissioning | Separate integrated inverter functions from add-ons; avoid charging twice for the same function |
An architecture label alone does not establish compatibility or efficiency. Ask for the single-line diagram, equipment revision, proposed backed-up circuits, control sequence and manufacturer-supported configuration. Electrical design, protection, conductor sizing and installation require the actual site and applicable review.
18. Make the survey and handover useful to the next owner
Start with 12 months of bills plus interval data where available; note EV charging, HVAC electrification and occupancy changes rather than assuming today’s annual total will persist. Record roof age/remaining service considerations, roof faces and obstructions, structural review inputs, service-panel details, equipment locations, access routes and owner objectives. A roof replacement and a PV mounting plan must agree about penetrations, flashing, future removal and who covers each interface.
Keep three evidence folders separate: building approval, utility interconnection/permission to operate, and owner operating evidence. The existing Fairfax/Dominion example remains address- and provider-specific. A signed contract or passed building inspection is not the same evidence as permission for parallel grid operation. Use the dated authority and utility records already listed in section 14; other jurisdictions need their own file.
| Required quotation attachment | What a reader should be able to verify |
|---|---|
| Production model | Coordinates, weather data/model version, each roof plane, shading/loss treatment and AC/DC boundaries |
| Storage schedule | Nominal versus available energy, reserve, output configuration and priority load list |
| Work scope | Roof interfaces, routing, panel changes, interface equipment, restoration and explicitly excluded work |
| Commercial breakdown | Gross equipment/labour, permit/utility/structural allowances, financing separately, tax assumptions dated |
| Commissioning record | Meter direction, monitoring, approved backup demonstration, notifications and account ownership |
| Service terms | Labour versus product warranty, response scope, monitoring responsibility and removal/reinstallation terms |
An owner-facing acceptance file should include approved equipment identifiers/serials, the as-built diagram, authority/utility closeout records, settings and reserves, labelled circuit schedule, maintenance contacts and an explanation of what stops during an outage. Demonstrations must be performed through the installer’s approved procedures; the homeowner should not open electrical enclosures or simulate utility loss by improvised disconnection.
Tax freshness checkpoint, 20 October 2026: IRS currently states that the Residential Clean Energy Credit is unavailable for property placed in service after 31 December 2025. This package does not subtract an automatic 30% credit. Other programs, ownership structures and business tax treatment require their own current eligibility analysis. [S12]
Compare the operating boundary before the price
“Panels and battery” is a product description. A reviewable proposal should connect the roof layout, production assumptions, selected backup circuits, reserve and commissioning evidence. Use the same demand brief for all firms and record an unanswered item as unanswered; a longer answer is not automatically a better installation.
Open the Solar & Storage three-offer worksheet to compare eight scope and evidence questions, record each firm's answer and download your notes. The worksheet does not score firms or approve a design. Notes stay only in the current tab until you export them.
19. HVAC: connect solar with a heat pump
HVAC means Heating, Ventilation and Air Conditioning. It brings heating, outdoor-air ventilation and cooling into one building-services brief. Here, the first detailed HVAC topic is the heat pump and its solar-electricity relationship. Domestic hot water is an adjacent service to coordinate explicitly.
Ventilation has its own job: heating or cooling recirculated room air does not establish a fresh-air supply. Ask which separate outdoor-air and exhaust arrangements the actual home needs. DOE's whole-house ventilation guidance distinguishes ventilation strategies and energy-recovery systems. [HP09] Ventilation sizing, filtration and humidity-control details remain separate design topics; a heat-pump label alone does not resolve them.
Plan the electricity supply and the heating system together. Solar PV can supply part of a heat pump's electrical demand; the heat pump also draws heat from its surroundings. The useful heat delivered to a room or tank is therefore a different quantity from the electricity consumed. ENERGY STAR explains this heat-transfer principle for air-source systems. [HP01]
This section covers a grid-connected home, space heating/cooling and domestic hot water. The connection drawing is a system-role explanation; the selected equipment still needs its own electrical, refrigeration or hydraulic design. Source review: 21 October 2026.
Follow electricity and heat as two separate flows
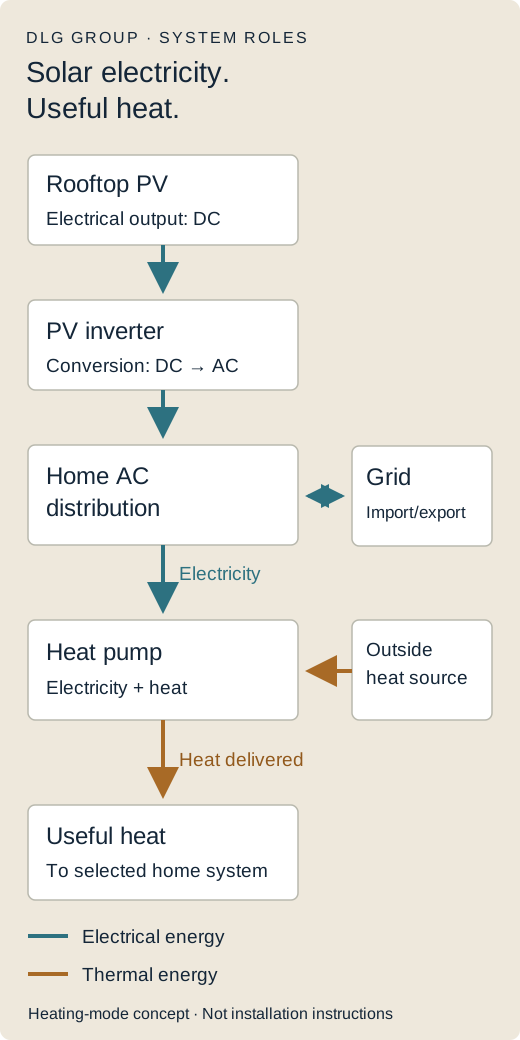
Electrical side: PV electricity reaches suitable conversion equipment and the home's distribution system. The heat pump is an electrical load within that coordinated design. Depending on the operating arrangement and available generation, its electricity may come from PV, the grid or compatible storage. A normal household heat pump is not connected directly to loose rooftop panel leads. Obtain the project's single-line diagram, circuit/protection design, service-capacity assessment and approved equipment configuration; this drawing supplies none of those installation values.
Thermal side: distinguish what the equipment actually heats. ENERGY STAR describes ducted and ductless air-source systems for room heating and cooling. [HP01] A separate heat-pump water heater serves domestic hot water. [HP04] An air-to-water system can instead serve a designed water-based heating arrangement; Daikin's European manufacturer example illustrates underfloor, low-temperature radiator and tank options. It is a technology reference, not proof of U.S. model availability, certification or approval. [HP07]
| Application | What the proposal should draw | Question that prevents a scope gap |
|---|---|---|
| Air-to-air space heating / cooling | Outdoor and indoor equipment, ducts or room units, controls, electrical supply and condensate route. | Which rooms receive the stated output, and how are existing ducts or room-unit positions assessed? |
| Air-to-water space heating | Selected equipment, flow/return arrangement, emitters, pumps, controls and any specified buffer or heat exchanger. | Can the actual emitters meet the room loads at the proposed water temperature? Is a buffer justified for this design? |
| Domestic hot water | A separate HPWH or an explicitly compatible heat-pump/cylinder arrangement, with potable-water and heating sides clearly identified. | What are the household draw profile, recovery behaviour, auxiliary-heater mode and required safe operating controls? |
Solar PV makes electricity; solar thermal collectors use sunlight as heat. A roof collector connected to a hot-water store is a different design from PV electricity supplying a heat pump. Identify which technology the quotation includes before comparing its diagrams or claims. [HP06]
Where the combination can help
| Potential benefit | Why it may help | Evidence to request |
|---|---|---|
| Less electricity for a given heating task | A heat pump transfers heat as well as consuming electricity; its performance depends on operating conditions. | Heating output and electrical input at the relevant outdoor and supply conditions, not a single best-case COP. [HP01] |
| Use more PV while it is available | Some heating or water-heating operation may be scheduled within a useful production window. | A matched demand/production profile and a control strategy that preserves comfort and required equipment operation. This is a planning opportunity, not a guaranteed self-consumption increase. [HP05] |
| Retain heat for a later need | A suitable hot-water store can separate some heating time from water-use time. | Usable hot-water delivery, standing losses, recovery, operating modes and professionally specified temperature/mixing controls. Stored heat cannot run lights or appliances. [HP08] |
| Coordinate renovation and future loads | The heating brief can inform roof-PV sizing, electrical review and controls before work is committed. | A building load calculation and documented equipment selection; efficiency improvements can change the required heating/cooling capacity. [HP02] |
Lower purchased energy, a lower bill and a lower emissions total are separate outcomes. Assess the existing fuel/system, actual tariff and export treatment, seasonal demand, equipment performance, installation/service costs and any recurring charges. No fixed saving, payback or emissions percentage is assumed here.
Check the winter, the operating mode and the outage
A sunny annual energy total does not prove adequate heating supply during a cold evening. Ask for monthly production and weather-linked heating demand, then examine the relevant cold-hour equipment output and electrical input. DOE's cold-climate field study records compressor, auxiliary-heating and defrost modes separately; its measured homes are not a forecast for this property. [HP03]
- Cold conditions: request the selected model's capacity/performance tables, auxiliary-heater rating and proposed control sequence. A nominal heating-output label is not its electrical demand.
- Daytime scheduling: use only manufacturer-supported controls and an agreed comfort strategy. Avoid bypassing compressor protections or making the main supply a crude solar on/off switch.
- Battery backup: add the heat pump, fans/pumps and any auxiliary heater to the actual backup-load schedule. Check energy, continuous/starting power and the approved islanding arrangement separately. A controls-network UPS does not supply the heating equipment.
- Hot water: specify location/airflow, noise, drainage, access, recovery and operating modes for the actual product. ENERGY STAR notes that colder conditions and backup resistance operation can increase water-heating electricity use. [HP04]
For hydronic proposals, ask the designer to label the space-heating circuit and potable-water side separately and show the selected heat exchangers, protective components and control responsibilities. An attractive tank-and-pipes picture cannot establish compatibility. Agree who reviews any cooling or freeze-protection functions instead of assuming every water-based arrangement supports them.
Worked example: heat delivered versus electricity purchased
Invented matched interval, not a regional or product forecast: assume the home needs 24 kWh of useful heat, a constant system COP of 3.0, and 4 kWh of surplus AC PV electricity that coincides with heating after other loads are supplied. The electrical requirement is 24 ÷ 3 = 8 kWh. In this simplified case, 4 kWh comes directly from PV and 4 kWh from the grid. Environmental heat contributes the remaining 16 kWh to the 24 kWh delivered.
COP here means useful thermal output divided by electrical input over the stated boundary. It is not a fixed annual promise or a percentage saving. With the same 24 kWh heat task at an assumed COP of 2, electricity would rise to 12 kWh. At an instant requiring 12 kW of heat and an assumed COP of 2, the corresponding input is 6 kW before any excluded loads: check this power separately from the interval's energy.
Keep the existing example honest: the earlier 900 kWh/month household and hourly solar example have not been recalculated as heat-pump cases. First establish whether their consumption already includes heating and hot water. When replacing an existing load, remove the appropriate old electrical contribution before adding a new estimate; record fuel use separately. Do not add a full new heating estimate to a baseline that already contains the same load.
Make one team own the interfaces
| Review point | What to ask the firms to deliver |
|---|---|
| Before selecting equipment | Room/building heating and cooling loads; existing fuel and electricity records; weather-linked performance; emitter/duct assessment; intended hot-water use and outage objective. |
| Before pricing the coordinated scope | Selected models; PV/heat-pump demand model; electrical single-line and service review; water/refrigerant/condensate routes where applicable; equipment location, access and noise review; controls sequence and exclusions. |
| Before installation | A named party for each interface and a project-specific permit/inspection file. Record which local building/mechanical, electrical, plumbing, utility and property enquiries apply; do not assume a single solar permit covers all equipment. |
| At handover | Commissioning record; demonstrated heating/hot-water and scheduling modes; auxiliary/backup behaviour within approved safe procedures; settings and owner access; manuals, warranties, support and unresolved items. |
Use the Solar & Storage three-offer worksheet and record heat-pump integration questions beside its demand, backup, scope and handover rows. A separate HVAC and solar quotation should identify the shared model and interface responsibilities. The Smart Homes guide supports the controls and ownership questions; the Renovation permits guide supports the local enquiry sequence.
Three useful companion decisions
DLG's recommended review order is to assess the envelope and heating load, compare hot-water scheduling and thermal storage, then coordinate EV charging and other flexible electrical loads with the remaining PV and service capacity. These are planning priorities for the property's brief, not a universal equipment package. EV charging deserves a separate worked example before anyone claims that the same midday surplus can serve heating, a battery and a vehicle simultaneously.
Heat-pump integration sources and scope — reviewed 21 October 2026
- HP01 · U.S. EPA / ENERGY STAR, Air-Source Heat Pumps. Heat-transfer principle, heating/cooling and ducted/ductless roles. No generic efficiency percentage applied to this home.
- HP02 · U.S. DOE Building Science Education, HVAC — Cold Climate Heat Pump Sizing. Building loads, equipment selection and climate-related sizing topics.
- HP03 · U.S. DOE Heat Pump Database, NREL cold-climate field validation, 2021–2023. Distinguishes monitored operating modes; no study results transferred to a DLG concept house.
- HP04 · U.S. EPA / ENERGY STAR, Heat Pump Water Heaters. Location, sizing, operating conditions and maintenance questions. Exact space/temperature/circuit requirements remain product-specific.
- HP05 · U.S. DOE, Heat Pump Water Heaters: peak reduction and load shifting, 11 December 2019. Historical field-research context for shifting heating time; no percentage saving used as a residential promise.
- HP06 · University of Michigan Center for Sustainable Systems, Solar PV Energy Factsheet. PV versus solar thermal and timing of production/demand; no national statistic copied into the example.
- HP07 · Daikin Europe, Air-to-water low-temperature technology. Manufacturer reference for hydronic/emitter/tank roles. European context; not a U.S. product recommendation, certification check or quoted installation design. Its solar-thermal marketing figures are not applied to PV.
- HP08 · U.S. EPA / ENERGY STAR, HPWH Installation Best Practices. Access, airflow, condensate, operating modes and thermal-storage/mixing-control context. No tank-temperature or plumbing recipe is prescribed here.
- HP09 · U.S. DOE Building Science Education, HVAC Whole-House Ventilation. Outdoor-air exchange and ventilation-system roles; no universal ventilation rate applied to the property.
WORKED ENERGY LEDGER / ORIGINAL DLG EXERCISE
One day, one solar supply: allocate it once.
Start with the same home loads before comparing a control change with a battery. This invented day connects PV timing, a heat-pump water heater and electrical storage without assigning the same surplus to more than one use.
Same daily electricity: 22.10 kWh load and 18.00 kWh AC PV in every case.
What changes: when the 3.10 kWh HPWH job runs, then whether remaining surplus can charge a battery.
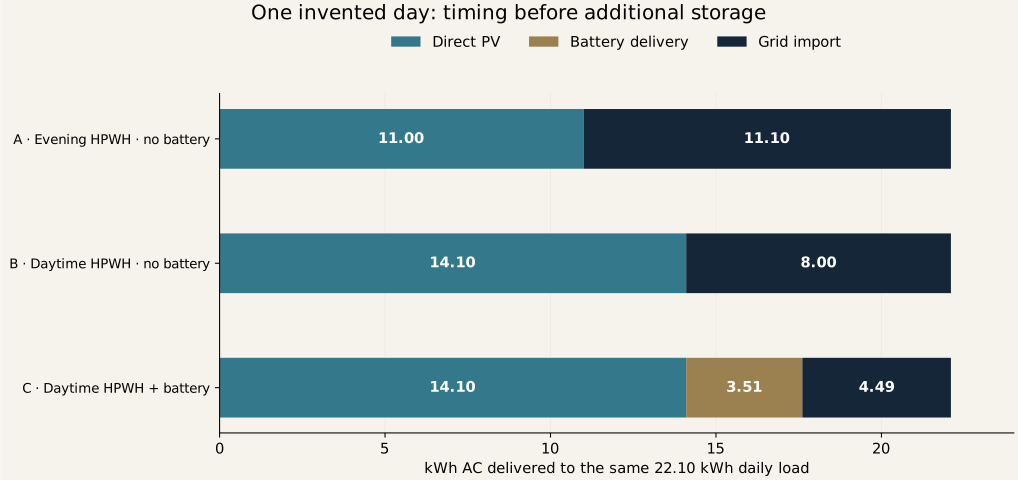
| Case | Direct PV | Battery to load | Grid import | Export | Battery loss |
|---|---|---|---|---|---|
| A · Evening HPWH · no battery | 11.00 | 0.00 | 11.10 | 7.00 | 0.00 |
| B · Daytime HPWH · no battery | 14.10 | 0.00 | 8.00 | 3.90 | 0.00 |
| C · Daytime HPWH + battery | 14.10 | 3.51 | 4.49 | 0.00 | 0.39 |
Inputs and operating boundaries
This is a separate companion case, not the earlier 30.00 kWh load / 33.40 kWh PV hourly case. The day has four six-hour bins: 00–06, 06–12, 12–18 and 18–24. Other household loads are 3 / 5 / 6 / 5 kWh; PV is 0 / 10 / 8 / 0 kWh. These are invented amounts, not data for Massachusetts, Virginia or Atlanta. The HPWH job is the rounded 3.10 kWh electrical result from the 200-litre heating arithmetic; its actual load shape and safe operating window still require the selected equipment and household demand.
Case A places that job in the evening bin. Cases B and C place it in 06–12. Case C additionally assumes a battery with 5.00 kWh of deliverable AC capacity, 90% lumped round-trip efficiency and zero initial stored energy. It charges only from PV left after loads; no grid charging. Loss is accounted for on charging as a bookkeeping convention. There is no reserve, degradation, standby load or power-limit model; final stored energy is also zero.
What the comparison actually tells you
- Timing first: A to B moves 3.10 kWh from grid use to direct PV in this profile. The heating job still consumes the same electricity; no efficiency gain is assumed.
- Use the remaining surplus once: after B's daytime loads, only 3.90 kWh of PV remains. C sends that to the battery; at the assumed 90% efficiency it delivers 3.51 kWh later and loses 0.39 kWh. The full 5.00 kWh capacity is not filled by this day's surplus.
- Check the balance: in C, PV 18.00 + grid 4.49 = loads 22.10 + losses 0.39. A daily net-energy deficit of 4.10 kWh does not mean 4.10 kWh of gross grid import when timing or losses intervene.
- Energy is not backup power: this case has no backup reserve and does not test inverter power, starting demand, auxiliary heaters or islanding. It cannot establish outage duration or equipment size.
Turn the example into questions for the firm
Request interval PV and load inputs for the actual property, a separate HPWH demand/control review, the AC/DC loss boundary, usable battery capacity, charge/discharge power, reserve settings and an outage-load schedule. For financial comparison, request the import tariff, export credit, fixed charges, installed price and recurring costs. No price, bill saving, payback or incentive is assumed in this exercise.
Download the 12-row energy ledger (CSV) · Read inputs and unrounded data (JSON)
Calculation method and source scope
Each bin uses direct PV = min(load, PV). Remaining PV may charge C's battery, subject to remaining deliverable capacity divided by 0.90. Remaining load may discharge stored deliverable energy; the rest is grid import. Export is PV left after charging. At day end, PV + grid import = loads + export + battery loss because the initial and final stored energy are equal. Six-hour totals can conceal short power spikes and within-bin mismatch, so this is arithmetic rather than a dispatch or sizing simulation.
Primary pages reviewed 28 October 2026 for heat-transfer, scheduling, storage-loss, power/energy and resilience roles only. The profile, 90% efficiency and 5 kWh capacity are DLG assumptions, not measured values or recommendations. The historic PNNL study supports the control question; its reported results are not copied into this model.
05 / Plan cleaning and maintenanceChapter 20 · Condition-based cleaning, safe access and the maintenance log.
20. Panel cleaning: method, timing and maintenance records
Dust, pollen, bird droppings and other deposits can prompt a cleaning review. Do not diagnose dirt from one low-production day: compare operating records, weather, shading and alarms with the installer before buying a cleaning service.
When should cleaning be considered?
The following is an original starting review schedule, not a manufacturer requirement, regional regulation or instruction to wash at each interval. Increase or reduce checks with the installer using site history.
| Review point | What to do | Cleaning decision |
|---|---|---|
| Monthly monitoring review | Check generation trends and system alerts through the normal owner interface. Record unusual changes. | A shortfall alone does not prove soiling; investigate the cause. |
| Spring and autumn visual review | Look from a safe ground-level position for deposits, leaves and visible damage; use existing photographs where useful. | Arrange assessment if deposits persist or access is needed. This is not a twice-yearly wash prescription. |
| After heavy pollen, dust, nearby works or concentrated bird deposits | Record the event and check safely for remaining contamination. | Discuss timely, targeted cleaning where warranted; do not wait for the next calendar date if a problem is evident. |
| After rain | Check whether visible deposits and the suspected loss actually cleared. | Do not assume rain has restored clean performance. |
| After an approved cleaning | Keep the service report and review subsequent performance under comparable conditions. | Use the result and recurrence to adjust the next review; promise no fixed yield recovery. |
NREL’s published North Carolina utility-scale study found that rainfall did not fully remove pollen-related effects at the studied sites. This supports checking rather than assuming self-cleaning; its loss percentages must not be applied to a Boston, Virginia or Atlanta home. [CL2]
Choose the method from the actual module instructions.
REC’s cleaning guidance describes cool panels, ambient-temperature water, gentle rinsing and soft non-abrasive tools. It prohibits high-pressure/steam cleaning and metal blades or sponges on its panels, and warns against standing or leaning on them. These are REC instructions, not universal pressure or chemical limits for every brand. [CL1]
- Water and tools: ask the provider to identify the approved water quality, pressure, brush or cloth and rinsing method for the module model. Avoid abrasive contact with trapped grit.
- Stubborn deposits: obtain the manufacturer-approved method rather than improvising acids, solvents, detergents or anti-soiling coatings. A chemical allowed by one manual is not automatically allowed by another.
- Powered brushes, robots and specialist systems: request compatibility and warranty confirmation before use. Equipment marketing is not permission to use it on the installed glass or coating.
- Snow and ice: treat these as a separate access and operating question. Ask the installer; do not scrape, walk on the array or pour hot water over it.
Ground-level observation is different from roof work.
Keep routine owner checks at a safe location. Roof access, fall protection, electrical assessment and any disconnection belong in a competent service provider’s work plan. REC warns that damaged wet panels can present a lethal shock hazard. If cracks, loose wiring or damaged components are suspected, stop cleaning and contact the installer; do not handle connectors or spray damaged equipment. [CL1]
Questions for a cleaning quotation
- Which module model/manual and warranty conditions govern the work?
- How will the provider manage roof access, water and electrical hazards without loading the modules?
- Which water, tools and products are proposed; are stubborn deposits and hard-water residue included?
- What happens if damage or loose equipment is found before work begins?
- Will the report include before/after photos, method, date, observations and unresolved issues?
- What is excluded from the price, and does the work comply with the lease or maintenance contract?
Apply the same logic in each focus region.
For Greater Boston, Northern Virginia and Metro Atlanta, record the actual roof access, tree cover, pollen/deposit history, weather exposure and installer advice. Set timing for the property rather than assigning an identical annual washing count to an entire state. Regional inspection and access requirements still need local review.
Download the panel cleaning and review log (CSV) ↗
Cleaning references
- CL1 — REC: Quick guide to cleaning. Brand-specific reference; confirm the current model manual.
- CL2 — NREL research: rainfall and pollen. Study published18December2023; North Carolina utility-scale context.
Sources, assumptions and review dates
A useful solar proposal explains more than how many panels fit on a roof. It connects the building, electricity use, expected production, equipment, ownership and the behaviour you want during a power outage.
This guide brings together U.S. public energy resources and a manufacturer mounting example. It is a planning guide for homeowners and property readers, not an electrical design or an estimate for a particular house.
Sources and scope
Checked 19 October 2026. Public sources provide system concepts; the mounting manufacturer describes its own products. The numerical home and budget are labelled teaching assumptions. Fairfax County and Dominion provide a local process example, not nationwide requirements. No exact structural design, conductor sizing or financial return is inferred. All imagery is illustrative.
S01 — US DOE: Consumer steps for going solar. Physical planning and responsibilities; historical incentive statements are not adopted.
S02 — US EIA: Energy storage for electricity generation. Power versus energy concepts only; old market statistics are not used.
S03 — US DOE: Solar energy and storage basics.
S04 — S-5!: PVKIT metal-roof mounting guidance. Load-path considerations for the named mounting context; no spacing or capacity copied into the concept detail.
S05 — US DOE: Inverters and grid services.
S06 — PVWatts: Calculator and cautions. Production estimates and modelling limits; section 12 is hypothetical, while section 15 links the implemented Solar Explorer and official model references.
S07 — US DOE: Solar and resilience basics.
S08 — US DOE: Homeowner’s guide to solar. Bill/ownership variables; no incentive figure adopted.
S09 — US DOE: Buying a house with solar. Documentation and ownership questions; no general property premium or lifespan forecast adopted.
S10 — EnergySage, Virginia: October 2026 installed solar cost benchmark. Marketplace data, not a project quotation.
S11 — EnergySage: Home battery guide, updated August 2026. National installed storage benchmark only.
S12 — IRS: Residential Clean Energy Credit. Post-2025 eligibility cutoff; checked 19 October 2026.
S13 — Fairfax County: Solar (SOLARR), residential permit. County pathway and conditional submission list, checked 19 October 2026.
S14 — Dominion Energy: Virginia net metering and self-service portal process guide. Applicant details, staged approval and PTO; actual service provider must be confirmed.
S15 — Model and location sources: PVWatts v8 API, Census 2026 Gazetteer, ZIP/ZCTA distinction, model service quotas and NOAA approximate geometry. Checked 19 October 2026; twelve official model responses, inputs, geography provenance and tests retained in DLG_Solar_Explorer_Full_v1.zip.
- S16 — Tesla: U.S. Powerwall 3 datasheet, 2025 edition, technical table p.2, checked 20 October 2026. Selected reference only; source values and toy-model assumptions are distinct. S12 IRS current page rechecked 20 October 2026.
Bring the vehicle into the energy plan.
Explore charging locations, scheduled charging and compatible surplus-solar controls alongside the home’s other loads.