
DLG GROUP · INSIGHTS / SOLAR & HOME PERFORMANCE
Small wind for homes and property
Start with wind at the proposed rotor position and the actual site constraints. Review certified performance, support arrangements, permissions, connection and maintenance as separate evidence questions.
ACTUAL PHOTOGRAPH / REFERENCE
See the setting before estimating the energy
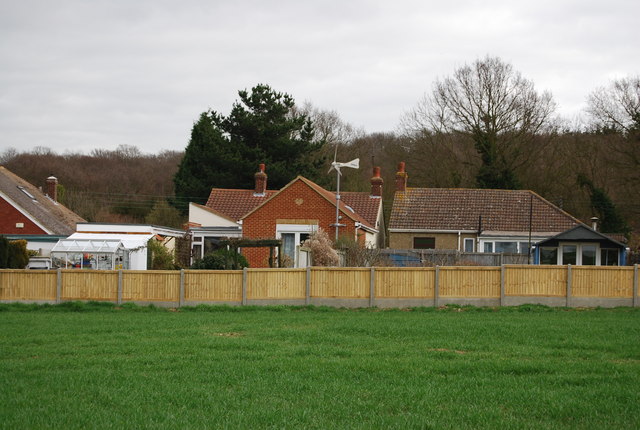
A small turbine beside a house in Blean, Kent, United Kingdom. Buildings and trees are part of the visible setting; the photograph supplies no rotor-height wind record, noise measurement or annual yield.
What to ask: Which obstructions, rotor height and measured or modelled wind inputs does your proposal actually use?Photo: Nigel Chadwick · 14 March 2009 · Wikimedia Commons source · CC BY-SA 2.0. Original image unchanged and uncropped. Source and licence reviewed 20 October 2026. Not a DLG project or an endorsed installation.01 / Wind resource & installation setting
A small wind turbine can supply electricity close to where it is used. Its value depends on the wind reaching the rotor, the support structure, the property’s permissions and the cost of keeping the system working. A compact shape or an impressive peak-power label cannot answer those questions on its own.
This guide covers detached homes, shared buildings and other properties. Roof mounting and a freestanding tower are separate building and site decisions. The Fairfax County references are starting points for a local enquiry; this guide does not establish that a turbine is permitted on a particular parcel.
1. Begin with the wind resource
Use the real reference photograph at the top alongside the review questions below.
Ask for a site assessment that identifies the proposed rotor height, nearby buildings, trees and terrain. A weather app or a ground-level wind reading does not establish the energy available at the intended turbine position. Record where the data came from, its height and period, and how it was translated to the actual site.
Use a wind map as an initial screening tool. Before committing to equipment, ask the assessor whether local measurement is warranted and how seasonal variation and uncertainty enter the estimate. Keep the proposed model, assumptions and limitations in the property file. DOE’s small-wind FAQ highlights wind resource, site size, tested equipment and utility conditions as feasibility considerations. [W01]
| Site question | Evidence to request | What it helps decide |
|---|---|---|
| What reaches the rotor? | Wind-speed distribution at the proposed height, with data provenance | Whether there is enough usable resource to proceed |
| What disturbs the flow? | Survey of trees, buildings, terrain and likely future obstructions | Whether the position exposes the rotor to turbulence |
| What space is available? | Property boundaries, access, candidate position and service route | Whether a support structure and maintenance access can fit |
| What energy is expected? | Model-specific power curve combined with site data and losses | Whether output justifies further design |
2. Roof mounting and a tower are different propositions
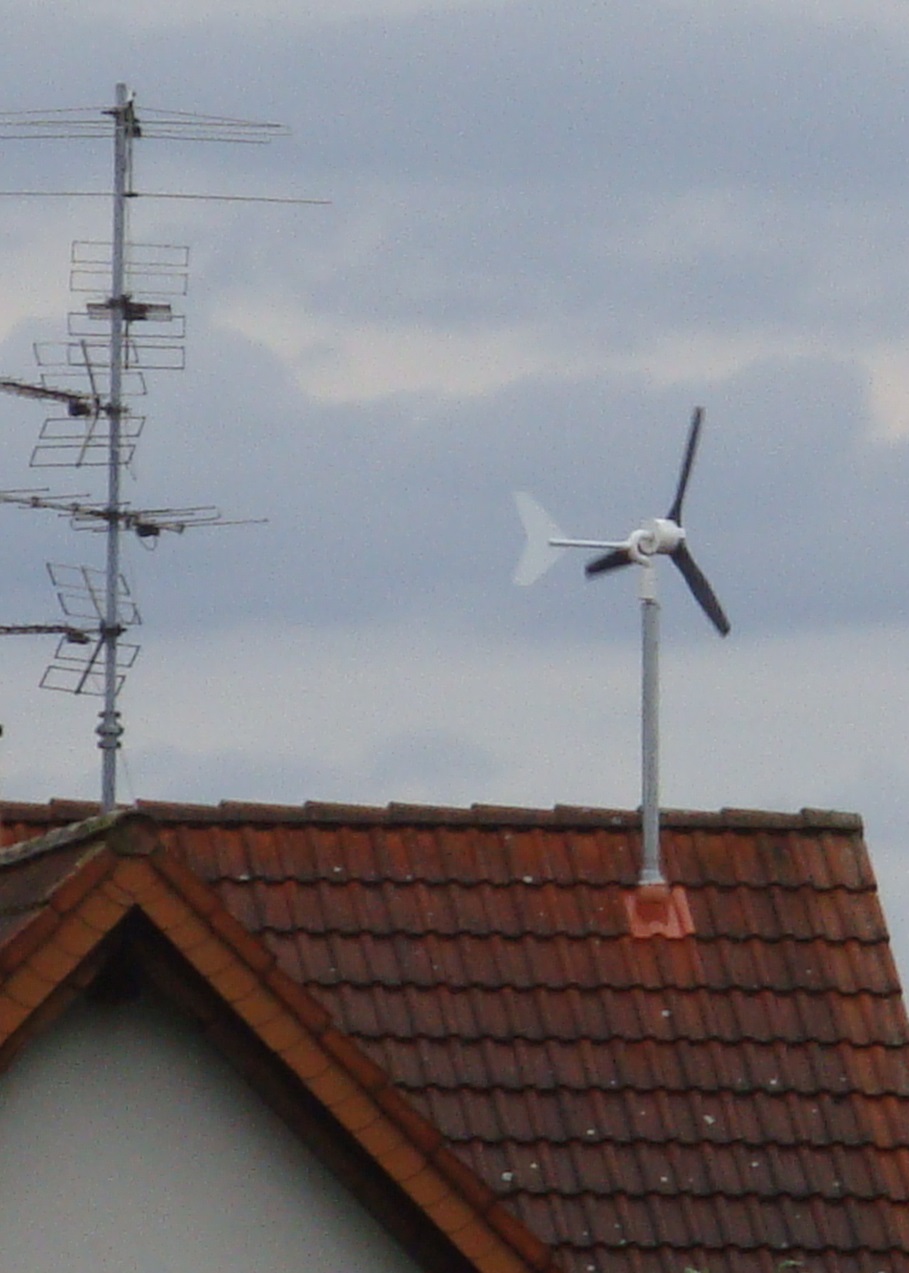
DOE notes that roof-mounted turbines can transfer vibration into the building and operate in disturbed airflow, reducing production and potentially equipment life. It describes these factors as reasons rooftop systems can be less economical than ground-connected towers. [W02] A windy-looking roof photograph is therefore not enough to support a production claim.
Closer look: a rooftop turbine is a separate assessment

ACTUAL PHOTOGRAPH / REFERENCE
A rooftop turbine is a separate assessment
Actual rooftop equipment reference from Germany. The visible pole and roof do not establish the hidden support, weatherproofing, vibration behaviour or energy output. This is not the certified turbine example discussed later in the guide.
What to ask: Who assesses the building connection and vibration, and what evidence supports production at this exact position?Photo: Andol · 8 October 2014 · Wikimedia Commons source · CC BY-SA 4.0. Original image unchanged and uncropped. Source and licence reviewed 20 October 2026. Not a DLG project or an endorsed installation.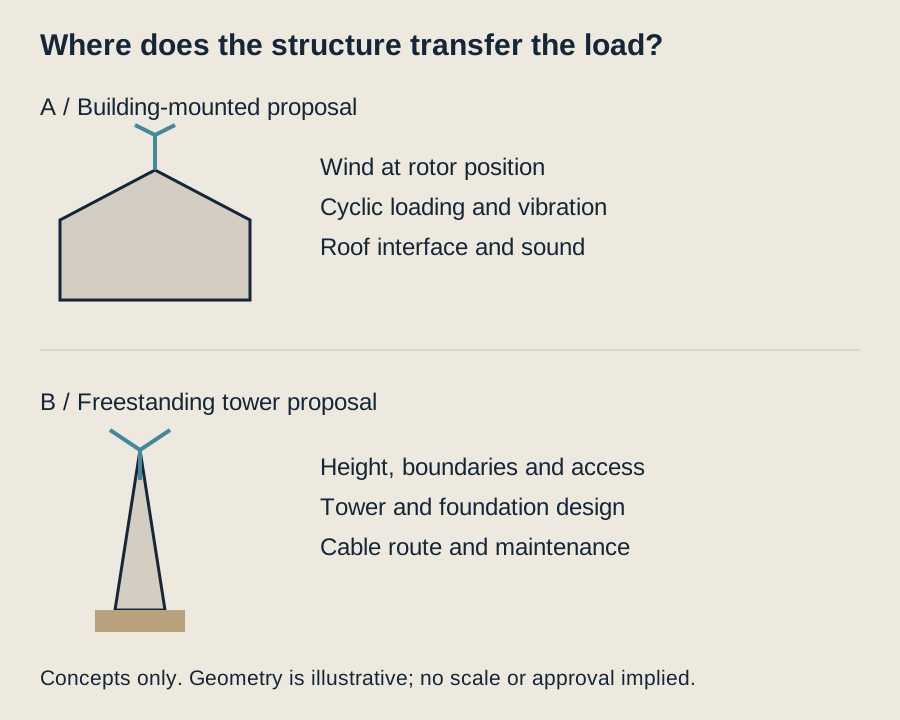
| Arrangement | Questions before design | Detail worth showing on the page |
|---|---|---|
| Turbine attached to a building | Is the resource measured at that position? How are cyclic loads, vibration and sound transmitted? What happens to roof waterproofing? | An actual engineered support and roof-interface detail, if available |
| Freestanding turbine on a tower | Can the height and position be approved? What foundation, access and any guy-wire area are needed? | Selected tower/foundation connection and measured site plan |
| Shared apartment or condominium property | Who controls the roof/land, authorizes works and carries maintenance liability? Which building permit classification applies? | Ownership/authorization map and equipment/access layout |
Do not add a generic roof cutaway merely to suggest that the installation is resolved. Until a product, structure and site are chosen, the review graphic is more informative. A real engineered detail can later sit in an optional “Closer look” panel without filling the main page with speculative construction imagery.
3. Read certified performance, not only the model name
Horizontal-axis and vertical-axis designs still need site evidence. Neither rotor orientation establishes annual output or removes the need for structural, noise and maintenance review. Ask the supplier for the exact tested configuration, including the controller, inverter and support arrangement being proposed.
The ICC-SWCC directory distinguishes rated power, peak power and annual energy. For AWEA-labelled entries, its annual-energy reference uses an average wind speed of 5 m/s; rated power uses 11 m/s. These are defined comparison conditions, not a forecast for your address. The directory also lists certification status and expiry. [W03]
A power label is not an annual energy promise
For teaching only, take a nominal 5 kW system. Assume annual energy divided by rated power × 8,760 hours gives a capacity factor of 10%, 20% or 30%. These are chosen arithmetic inputs, not typical roof performance or a site prediction.
| Assumed capacity factor | Calculation | Annual energy | Share of the solar guide’s 10,800 kWh household example |
|---|---|---|---|
| 10% | 5 × 8,760 × 0.10 | 4,380 kWh | 41% |
| 20% | 5 × 8,760 × 0.20 | 8,760 kWh | 81% |
| 30% | 5 × 8,760 × 0.30 | 13,140 kWh | 122% |
The exercise shows why “a 5 kW turbine supplies this house” is incomplete. Replace the assumed factor with a calculation using the actual turbine curve, wind distribution and system losses. Annual output still does not establish that generation will match household demand hour by hour.
02 / System, permissions & ownership
4. Understand the rest of the system
Ask the designer to explain the complete operating arrangement: turbine, support structure, controller and braking/protection functions, electrical conversion, building connection, monitoring and any storage. The drawing must be specific to the selected equipment. A solar inverter is not automatically compatible with a wind turbine.
| Component or interface | What to record |
|---|---|
| Rotor and generator | Selected model, performance evidence and access for inspection |
| Tower or building support | Structural design basis, load path and foundation/attachment responsibility |
| Control and protection | Manufacturer-required operating, shutdown and overspeed provisions |
| Cable route | Tower/building route, conduit, trenching where needed, grounding and surge/lightning assessment |
| Grid connection | Approved conversion/protection arrangement and utility conditions |
| Optional storage | Compatibility, usable energy, output limits and intended backup circuits |
This is a scope checklist, not an electrical schematic. Cable sizes, protection settings and mechanical connections belong in the project design. Battery storage is a separate choice; turbine installation alone does not establish outage backup. Ask for the promised operating modes to be demonstrated during commissioning.
5. Permissions: establish the parcel-specific route
For a Fairfax County property, begin with the county’s current Zoning Administration service and Land Development Services. Ask for the allowed use/classification, height and boundary conditions, noise requirements, applicable reviews and building/electrical permits for the actual proposal. The zoning service is the appropriate source for interpreting parcel-specific zoning questions. [W04] No current wind-specific entitlement or fixed setback is asserted here. An older discussion memo is not treated as adopted permission.
Prepare a pre-application enquiry with the address/parcel, ownership or shared-roof authority, proposed turbine and tower height, rotor diameter, a dimensioned site plan, nearby receptors, available sound/performance information, support concept and cable route. This is DLG’s proposed enquiry pack, not a verified mandatory county upload list. Request the authority’s written checklist before ordering equipment. Check any aviation, environmental or other agency review if triggered by the location and height.
For a Dominion-served Virginia property, contact the utility about the applicable connection pathway. Its parallel-generation guidance requires permission to connect and distinguishes net metering from other interconnection arrangements. [W05] Do not assume the solar example’s eligibility, equipment approvals or application details transfer unchanged to wind. Confirm the generating equipment, tariff, export treatment and operating authorization in writing.
| Workstream | Practical record to obtain |
|---|---|
| Property authority | Owner/shared-property permission and installer authorization as applicable |
| Zoning and siting | Written response identifying the parcel’s constraints and application route |
| Building and electrical review | Project-specific permit requirements and approved documents |
| Utility connection | Accepted application, connection conditions and permission to operate |
| Completion | Inspections, commissioning, equipment records and maintenance responsibilities |
6. Price the installed system and its upkeep
Keep wind costs separate from the solar cost-per-watt example. No current Fairfax small-wind installed-price benchmark has been established for this guide, so no equipment-only internet price is presented as a completed installation cost.
Request comparable quotations separating assessment/measurement, design, turbine and controls, support/foundation, delivery/lifting, electrical routes/trenching, connection work, permits, commissioning and taxes. Ask what happens if site work or utility review changes the proposed scope.
Then request the service plan: inspection tasks, access/lifting needs, shutdown procedure, parts availability, warranty exclusions, expected service costs and eventual removal. Compare the total against site-modelled annual energy and the actual tariff. DOE’s community-wind handbook treats performance, project economics and configuration selection as connected decisions. [W06] No payback or incentive income is assumed in this package. The solar companion separately records the current IRS Section 25D cutoff; historical wind-credit marketing should not be carried forward without checking eligibility.
7. Decide whether to proceed
Proceed to detailed proposals only when the property file can answer four questions: Is there useful wind at an approvable position? Is there evidence for the proposed turbine’s output? Can the complete system be installed and maintained? Does its cost make sense against the alternatives?
If the answers remain uncertain, keep wind as a feasibility topic. Solar, efficiency measures, storage and wind solve different parts of the energy question; evaluate them against the same household objectives and evidence standard.
03 / Evidence, feasibility & handover
8. Read one real certificate before reading a sales headline
The SD Wind Energy SD6 certificate, SWCC 11-04, checked 20 October 2026, lists AWEA 9.1–2009 certification and an expiry date of 1 July 2027. It reports 8,950 kWh/year at a reference annual average wind speed of 5 m/s with a Rayleigh distribution, sea-level air density and 100% availability; 5.2 kW at 11 m/s; and 6.1 kW peak at 17 m/s. Those are three distinct ratings. They do not predict the output of a particular parcel or authorize a particular installation. [W07]
For scale, the reference 8,950 kWh is about 82.9% of a hypothetical 10,800 kWh annual home demand. That ratio describes annual quantities under the certificate’s reference conditions. It says nothing about hour-by-hour matching, export limits, storm shutdowns or electricity available during a grid outage. Compare certificates under equivalent standards and reference conditions; do not rank different models by a peak number alone.
Why the wind-speed distribution matters
The following is a wholly fictional five-bin exercise. Power values are invented for an unnamed teaching turbine; they are not the SD6 curve. Bin speeds represent all hours in each bin, so the table is intentionally coarse. It assumes the power values already represent the chosen delivered-energy boundary; no second electrical loss is added.
| Representative speed | Assumed delivered power | Assumed annual hours | Energy = power × hours |
|---|---|---|---|
| 1 m/s | 0 kW | 2,500 | 0 kWh |
| 3 m/s | 0.05 kW | 2,500 | 125 kWh |
| 5 m/s | 0.50 kW | 2,000 | 1,000 kWh |
| 8 m/s | 2.50 kW | 1,000 | 2,500 kWh |
| 12 m/s | 5.00 kW | 760 | 3,800 kWh |
| Total | — | 8,760 | 7,425 kWh |
The weighted average speed is 37,120 / 8,760 = 4.24 m/s. Applying a single power value at that average speed would discard the distribution; this exercise is summed by bin instead. A blanket 5% downtime assumption would reduce 7,425 to 7,053.75 kWh only if the missing hours were proportionally distributed. Maintenance concentrated in windy periods would have a different effect. These numbers demonstrate the method; they are not a wind assessment, product quote or regional forecast.
For an actual proposal require the measured/modelled hub-height distribution, observation duration, instrument exposure, long-term adjustment, air-density treatment, selected certified curve, turbulence treatment, electrical boundary, availability and uncertainty. Record the sources and assumptions separately so a second assessor can reproduce the result. A general map or nearby airport average is screening evidence rather than a complete micro-siting study. [W01–W03]
See which hours carry the energy
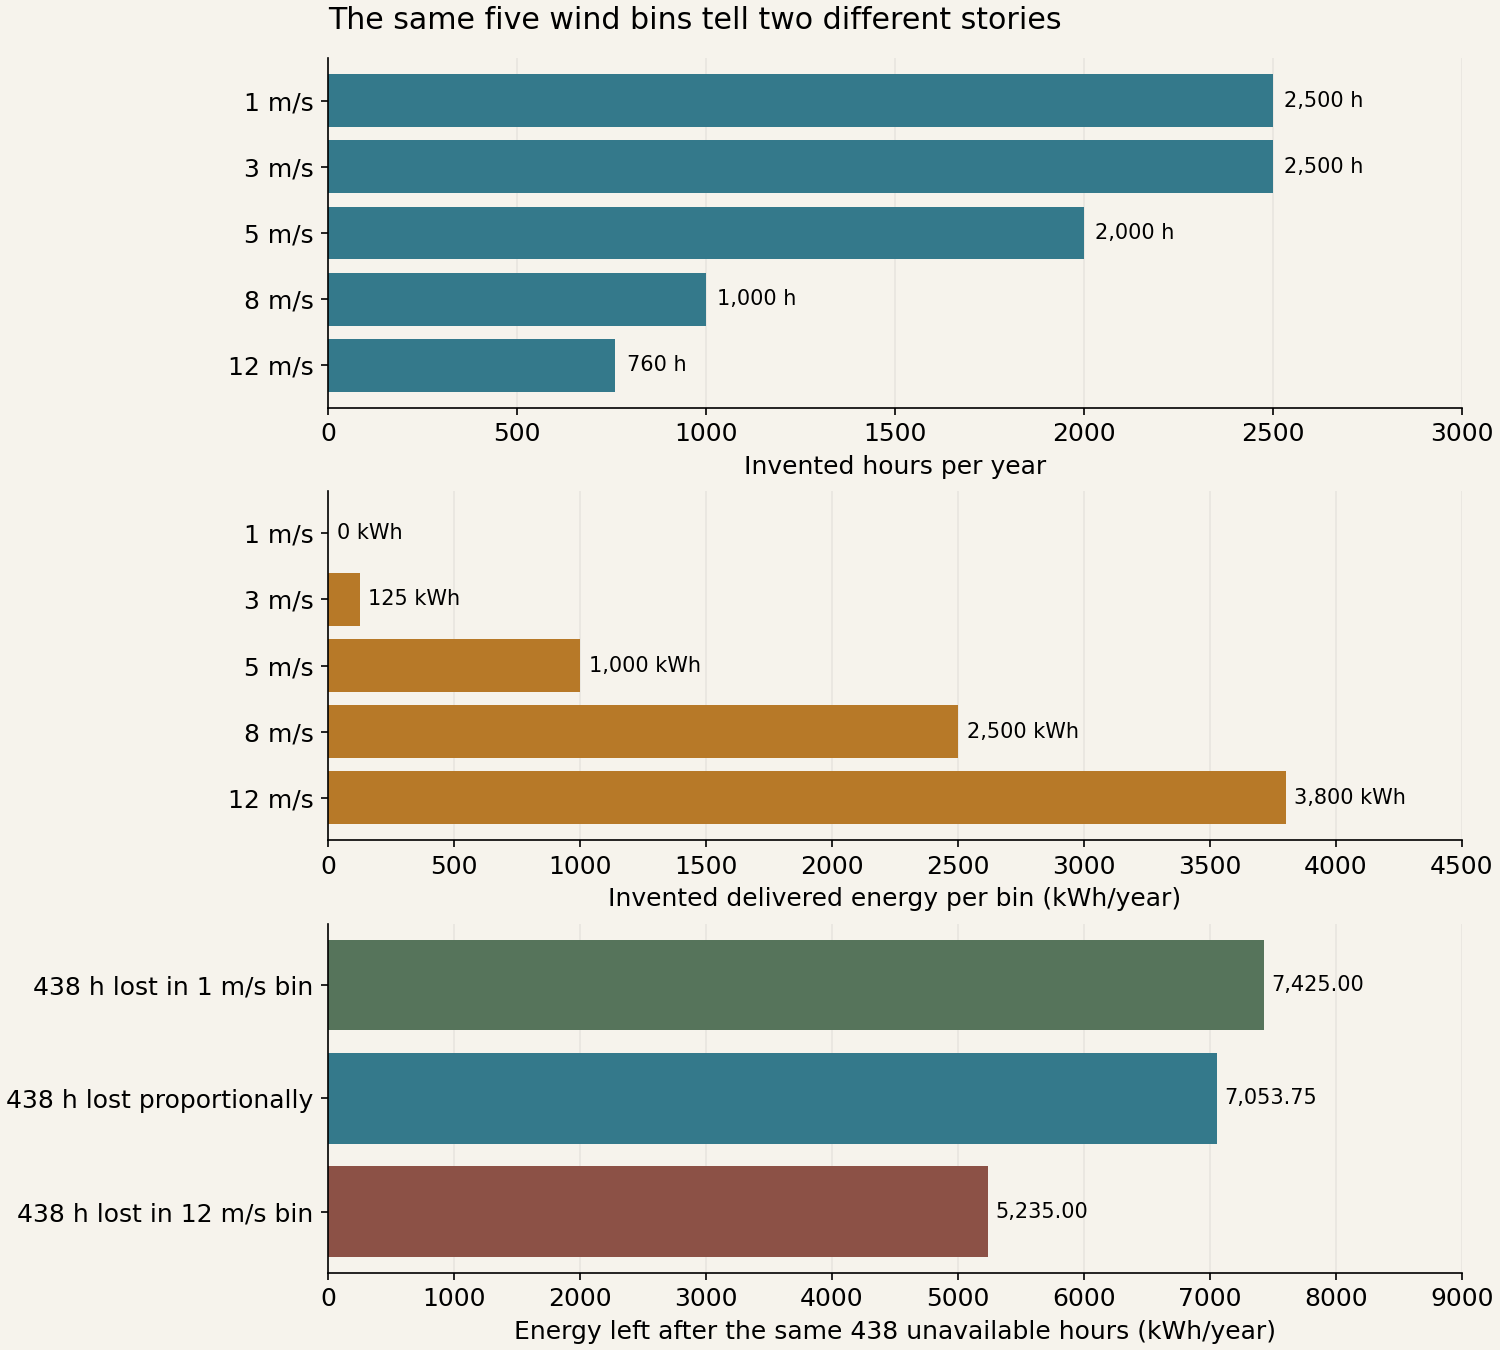
The 12 m/s bin accounts for 760 / 8,760 = 8.7% of the hours, but supplies 3,800 / 7,425 = 51.2% of this exercise’s energy. Counting windy hours and counting produced energy answer different questions.
The same downtime can remove very different energy
Five percent of the assumed year is 438 hours. Keep every original bin unchanged except the hours made unavailable. Each case below removes the same 438 hours; both the 1 m/s and 12 m/s bins contain enough hours for these deliberately extreme comparisons.
| Where the 438 hours are lost | Energy removed | Energy remaining |
|---|---|---|
| All in the assumed 1 m/s / 0 kW bin | 438 × 0 = 0 kWh | 7,425 kWh |
| 5% of every original bin | 7,425 × 0.05 = 371.25 kWh | 7,053.75 kWh |
| All in the assumed 12 m/s / 5 kW bin | 438 × 5 = 2,190 kWh | 5,235 kWh |
This adds no new electrical loss: the assumed power values already use the delivered-energy boundary stated above. The result changes only because downtime removes different producing hours. None of these cases predicts actual maintenance timing, turbine reliability or a worst-case annual outcome.
Ask the assessor: is the availability adjustment applied uniformly, or does it use the seasonal timing of expected outages? Request the original speed distribution, delivered-power boundary and excluded hours so another reviewer can reproduce the energy figure.
9. Require a parcel feasibility file before selecting the turbine
| Gate | Evidence to request | Decision if unresolved |
|---|---|---|
| Resource | Candidate hub-height data, obstacles, terrain and seasonal distribution | Keep at screening stage; do not promise production |
| Siting | Parcel boundaries, buildings, service access, tower/service envelope and utility conflicts | Revise candidate position or stop |
| Local route | Written address-specific zoning/building path, conditional application list and other applicable restrictions | Do not treat a listing or ownership document as permission |
| Structural/interface | Selected tower/foundation basis, geotechnical inputs where required, corrosion/exposure and cable route | Obtain an engineered scope for the actual site |
| Electrical/utility | Supported inverter/control system, interconnection application and any export limit | Keep parallel operation pending the required closeout |
| Lifecycle | Access, lowering/lifting method, inspection schedule, parts, warranty labour and removal | Include ownership cost before proceeding |
Small wind should remain a conditional feasibility option, especially where surrounding buildings and trees dominate the resource. A roof mounting proposal must address structural load paths, vibration transmission, weatherproofing and access; a tower proposal must address its land and maintenance footprint. Neither is established by the turbine’s swept area alone. Existing Fairfax and utility links are process starting points, not a determination for Boston, Atlanta or every Virginia address.
Compare costs with delivered energy, using explicit assumptions
Suppose, purely for arithmetic, proposal A is $40,000 upfront with $600/year service allowance and 7,000 kWh/year delivered; proposal B is $30,000 with $900/year and 4,500 kWh/year. Over an assumed 20 years, with no discounting, degradation, downtime change, financing, replacements, taxes or incentives, the simple cost/energy ratios are:
- A: ($40,000 + 20 × $600) / (20 × 7,000) = $0.371/kWh.
- B: ($30,000 + 20 × $900) / (20 × 4,500) = $0.533/kWh.
These are fictional inputs, not installed-cost benchmarks or complete levelized-cost studies. The lower initial price is insufficient to choose between them. A serious comparison must add realistic component replacement/removal, discounting, confidence ranges and the actual value of self-consumed versus exported energy. Review the alternative of solar/storage or efficiency work against the same owner objective, rather than assuming wind must be installed.
10. Commission, maintain and hand over the installation
The completion file should identify the exact turbine/tower/inverter arrangement, approved design and as-built changes, utility status, serials, initial meter readings, inspection/maintenance requirements and storm/service contacts. Ask who can safely lower or access the turbine and how that future visit reaches the site. Keep independent production measurement and fault records so seasonal variation can be distinguished from prolonged unavailability.
A grid-connected turbine does not automatically deliver backup power. Any islanded operation requires an explicitly supported architecture and approved controls; do not assume the solar battery can accept the wind inverter. Demonstration and service belong to the responsible qualified team using the selected equipment’s procedures. The handover should explain normal operation, alarms, owner observation, and when to stop use and contact service—without asking the owner to climb, bypass protection or improvise braking.
Make the site estimate reproducible
Place the parcel, rotor height, resource period and delivered-energy boundary beside every offer. A rated-power label cannot fill a missing site file. If one firm cannot explain its wind-speed hours or service assumptions, record that gap before comparing the annual-energy or lifecycle figures.
Open the Small Wind three-offer worksheet to compare eight scope and evidence questions, record each firm's answer and download your notes. The worksheet does not score firms or approve a design. Notes stay only in the current tab until you export them.
Sources, assumptions and review dates
Sources and editorial scope
Checked 19 October 2026. Educational review questions and explicitly hypothetical arithmetic are DLG editorial material. No site assessment, installed-system design, county wind approval or current local wind quotation has been completed.
- W01 — US DOE: Small distributed wind FAQ. Feasibility subjects; historical price and incentive claims not adopted.
- W02 — US DOE: Small Wind Guidebook. Roof vibration/turbulence and siting concepts only.
- W03 — ICC-SWCC: Certified small turbines and rating definitions. Reference conditions and status fields; no manufacturer recommendation.
- W04 — Fairfax County: Zoning Administration Division and Land Development Services. Authority contacts; parcel-specific wind provisions still require confirmation.
- W05 — Dominion Energy: Virginia parallel generation and interconnection. Connection permission and pathway distinction.
- W06 — US DOE: Small Community Wind Handbook. Performance, economics and configuration process; no old net-metering description adopted as a current tariff.
- W07 — ICC-SWCC: SD6 certificate SWCC 11-04, July 2026 file, pp.1–2, checked 20 October 2026. Reference energy/rated/peak conditions and expiry; not an actual parcel forecast.