Rainwater potential: compare the months, then the tank
Start with the intended water use. Compare roof collection, rainfall timing, usable storage, overflow and maintenance as separate parts of the proposal.
Prepared 20 October 2026 · Depth revision 20 October 2026 · WATER-09 regional extension · 1991–2020 climate normals · Photo-led reading update: 27 October 2026 · Data and event comparison recheck: 28 October 2026
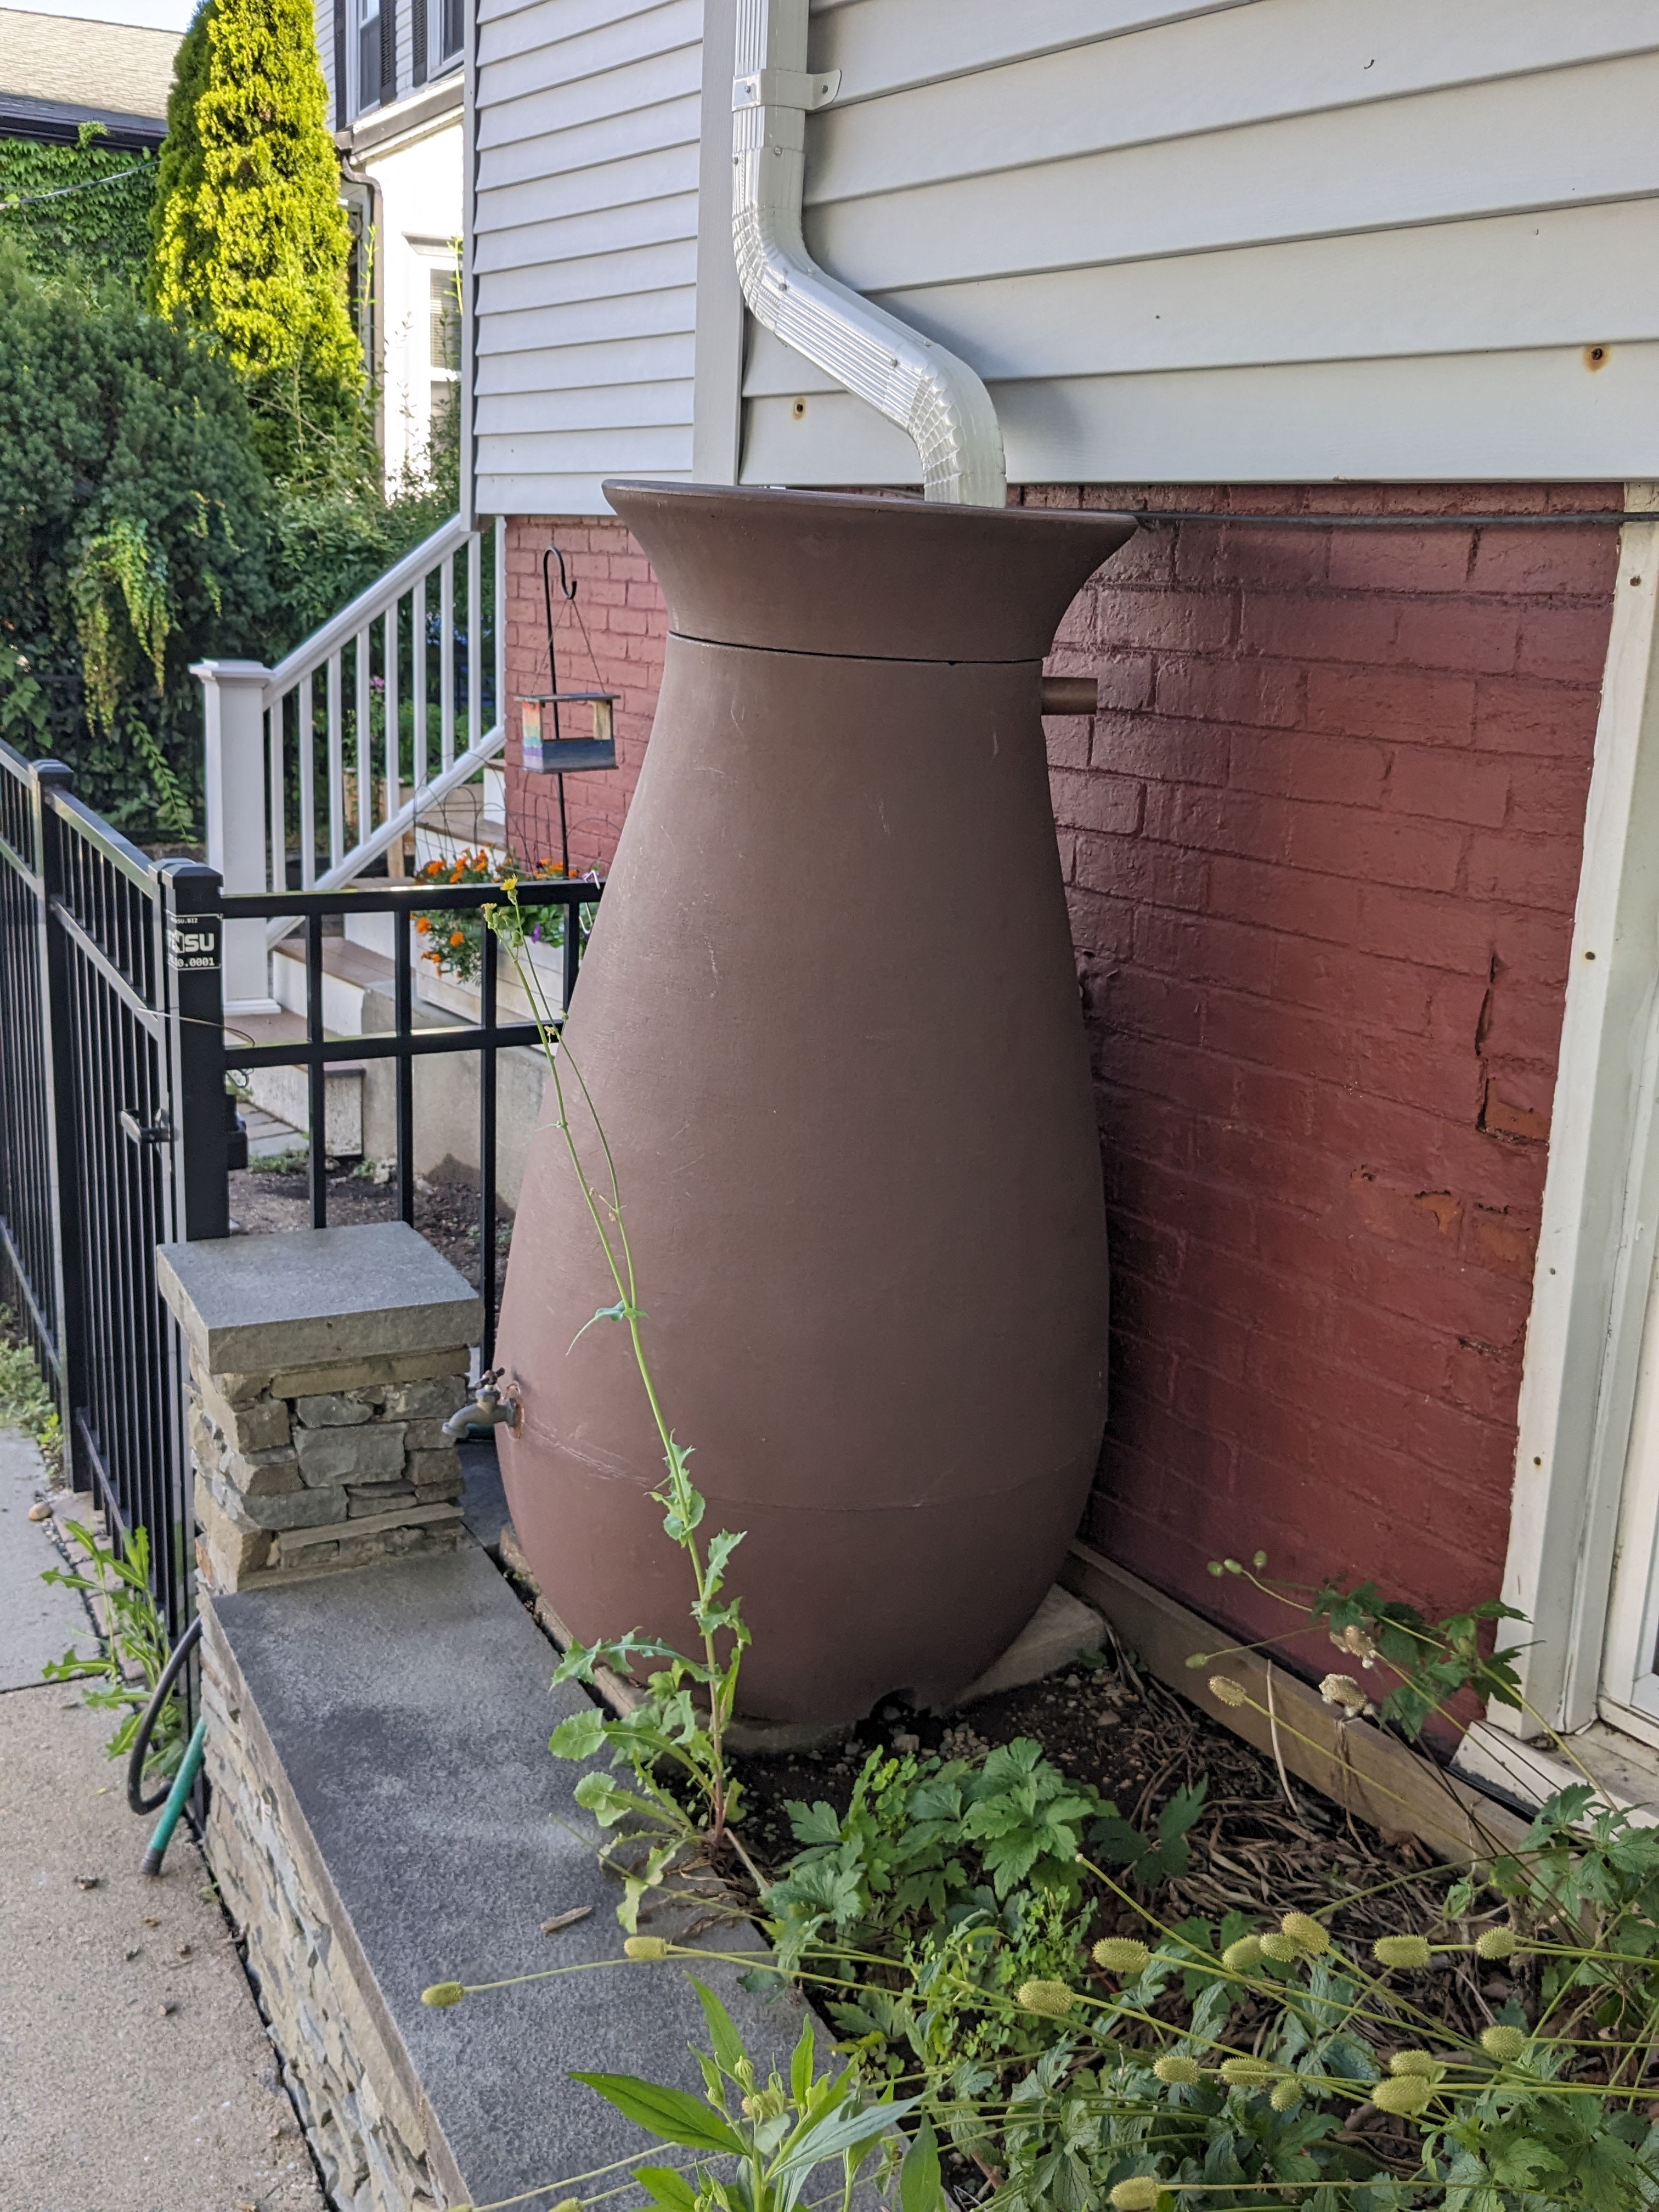
Actual urban rain-barrel reference in Somerville, Massachusetts. The inlet, lower tap and side opening can be seen. Tank volume, support capacity, overflow destination, water quality and performance have not been verified.
What to ask: Show the complete full-tank overflow route, usable volume, support assessment and seasonal operating instructions in the actual proposal.Photo: Phoebe · 30 July 2023 · Wikimedia Commons source · CC BY-SA 4.0. Original image unchanged and uncropped. Source and licence reviewed 20 October 2026. Not a DLG project or an endorsed installation.
Watch roof-to-garden concept film · 21 seconds
From roof to garden · 21 seconds
Roof collection, storage and garden use, illustrated with AI-generated concept stills. This short photo-led film introduces the system; it does not establish an approved installation detail or drinking-water quality.
A complete proposal must also identify screening, maintenance access, support, overflow, seasonal shutdown and the intended water use. The regional rainfall and storage calculations that follow are separate from this illustrative film.
01 / Compare the rainfall and roofChapters 1–3 · Station context, monthly patterns and the same assumed roof.
1. Know the point behind the regional label
Research area
Actual reference point
Station ID
Coordinates supplied with the normals
Greater Boston
Boston Logan International Airport
USW00014739
42.3606° N, 71.0106° W
Northern Virginia
Washington Dulles International Airport
USW00093738
38.9408° N, 77.4636° W
Atlanta region
Atlanta Hartsfield International Airport
USW00013874
33.6300° N, 84.4417° W
An airport station is a point reference, not the average of its whole metropolitan area or a property-specific roof measurement. Dulles does not stand for every NOVA locality. The coordinates above are the metadata in this normals product; they are not a reconstruction of every historical station position.
The source variable is MLY-PRCP-NORMAL, the long-term average monthly precipitation total. All three series use the same 1991–2020 reference period. Normals describe a seasonal climate baseline; actual months and individual storms can differ substantially. [RW01–04]
2. Read the monthly precipitation pattern
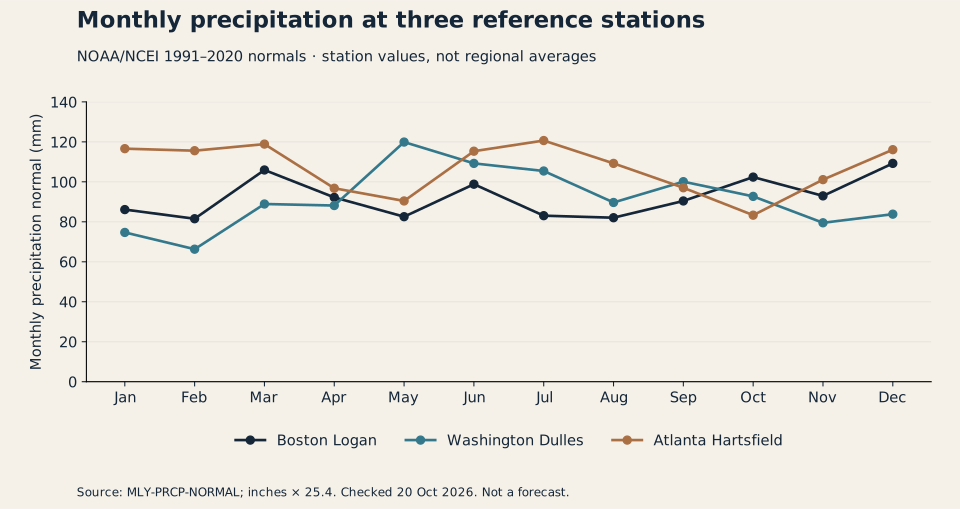
Original chart calculated from NOAA/NCEI station data. Inches were converted to millimetres using 25.4 mm per inch. Lines join monthly values for reading; they do not describe daily rainfall or a forecast.
Month
Boston Logan (mm)
Washington Dulles (mm)
Atlanta Hartsfield (mm)
Jan
86.1
74.7
116.6
Feb
81.5
66.3
115.6
Mar
105.9
88.9
118.9
Apr
92.2
88.1
96.8
May
82.5
119.9
90.4
Jun
98.8
109.2
115.3
Jul
83.1
105.4
120.7
Aug
82.0
89.7
109.2
Sep
90.4
100.1
97.0
Oct
102.4
92.7
83.3
Nov
93.0
79.5
101.1
Dec
109.2
83.8
116.1
At these reference points, Boston’s lowest normal is February and its highest is December; Dulles is lowest in February and highest in May; Atlanta is lowest in October and highest in July. These describe this dataset, not a promise about the next season. [RW02–04]
Precipitation includes the liquid-water equivalent of frozen precipitation in the measurement system. It must not be interpreted as immediately harvestable liquid rain during winter. Snow accumulation and melt timing, freezing, winter bypass or system shutdown can change usable inflow. [RW05] No snowmelt or cold-weather operating model is included here.
3. Put the same roof under each series
The comparison uses a 100 m² connected horizontal roof catchment and an assumed 0.80 collection factor. The factor is a shared scenario input, not a measured local efficiency or a certified roof-material coefficient.
One millimetre on one square metre equals one litre. One US gallon equals 3.785411784 L. Only the roof area actually connected to the collection system belongs in the formula; do not replace horizontal contributing area with the full sloping roof-surface area.
For Boston January, the source value is 3.39 in. Converted without intermediate rounding: 3.39 × 25.4 = 86.106 mm. At the comparison settings: 86.106 × 100 × 0.80 = 6,888.48 L, displayed as approximately 6,888 L. This is potential inflow before a tank or demand calculation.
Do not apply another generic 20% loss after using 0.80; that would count the same assumed loss twice. Conversely, do not assume this one factor has explicitly modelled every first-flush event, roof loss, filter condition or maintenance outage. Those need actual system evidence.
Reference station
Annual precipitation normal
Arithmetic collection potential
May–September potential
Boston Logan
1,107.2 mm
88,575 L
34,950 L
Washington Dulles
1,098.3 mm
87,864 L
41,940 L
Atlanta Hartsfield
1,280.9 mm
102,474 L
42,611 L
Annual and seasonal totals are sums of the supplied monthly normals, calculated before display rounding. Annual figures include cold-season precipitation equivalent and are not a promise of annual usable water. The May–September column is a common comparison window, not a verified irrigation season for every site.
Monthly collection potential — Boston Logan
100 m² connected horizontal roof × precipitation × assumed 0.80 collection factor. These are potential inflows before tank limits and operating restrictions.
Month
Source precipitation (in.)
Converted precipitation (mm)
Potential (L)
Potential (US gal)
Jan
3.39
86.1
6,888
1,820
Feb
3.21
81.5
6,523
1,723
Mar
4.17
105.9
8,473
2,238
Apr
3.63
92.2
7,376
1,949
May
3.25
82.5
6,604
1,745
Jun
3.89
98.8
7,904
2,088
Jul
3.27
83.1
6,645
1,755
Aug
3.23
82.0
6,563
1,734
Sep
3.56
90.4
7,234
1,911
Oct
4.03
102.4
8,189
2,163
Nov
3.66
93.0
7,437
1,965
Dec
4.30
109.2
8,738
2,308
Monthly collection potential — Washington Dulles
100 m² connected horizontal roof × precipitation × assumed 0.80 collection factor. These are potential inflows before tank limits and operating restrictions.
Month
Source precipitation (in.)
Converted precipitation (mm)
Potential (L)
Potential (US gal)
Jan
2.94
74.7
5,974
1,578
Feb
2.61
66.3
5,304
1,401
Mar
3.50
88.9
7,112
1,879
Apr
3.47
88.1
7,051
1,863
May
4.72
119.9
9,591
2,534
Jun
4.30
109.2
8,738
2,308
Jul
4.15
105.4
8,433
2,228
Aug
3.53
89.7
7,173
1,895
Sep
3.94
100.1
8,006
2,115
Oct
3.65
92.7
7,417
1,959
Nov
3.13
79.5
6,360
1,680
Dec
3.30
83.8
6,706
1,771
Monthly collection potential — Atlanta Hartsfield
100 m² connected horizontal roof × precipitation × assumed 0.80 collection factor. These are potential inflows before tank limits and operating restrictions.
Month
Source precipitation (in.)
Converted precipitation (mm)
Potential (L)
Potential (US gal)
Jan
4.59
116.6
9,327
2,464
Feb
4.55
115.6
9,246
2,442
Mar
4.68
118.9
9,510
2,512
Apr
3.81
96.8
7,742
2,045
May
3.56
90.4
7,234
1,911
Jun
4.54
115.3
9,225
2,437
Jul
4.75
120.7
9,652
2,550
Aug
4.30
109.2
8,738
2,308
Sep
3.82
97.0
7,762
2,051
Oct
3.28
83.3
6,665
1,761
Nov
3.98
101.1
8,087
2,136
Dec
4.57
116.1
9,286
2,453
02 / Compare demand and storage timingChapters 4–7 · Stated demand, tank examples and sensitivity.
4. Compare collection with a separately stated demand
Collection potential answers how much water could enter before storage limits under the assumptions. Demand answers how much is drawn, when, for which planting and through what delivery system. These need separate records.
For the timing exercise below, DLG assumes 4,000 L drawn in each month from May through September, distributed equally across that month’s days: 20,000 L total. This is an arbitrary teaching profile, not measured household use or an irrigation prescription. Garden area, plants, soil, effective rainfall on the garden and watering practice have not been used to calculate it.
The three stations’ May–September potential exceeds that assumed demand in total. That arithmetic comparison does not prove uninterrupted supply. A roof can collect more over a season while a small tank overflows during wet periods and runs dry between events.
The current application remains ornamental-plant planning. The existing guide’s roof-water example does not approve potable use or irrigation of edible herbs. Water quality, treatment, cross-connections, controls and local permissions remain separate system checks.
5. Use timing examples to understand the tank
ACTUAL PHOTOGRAPH / REFERENCE
Tank form is not usable storage
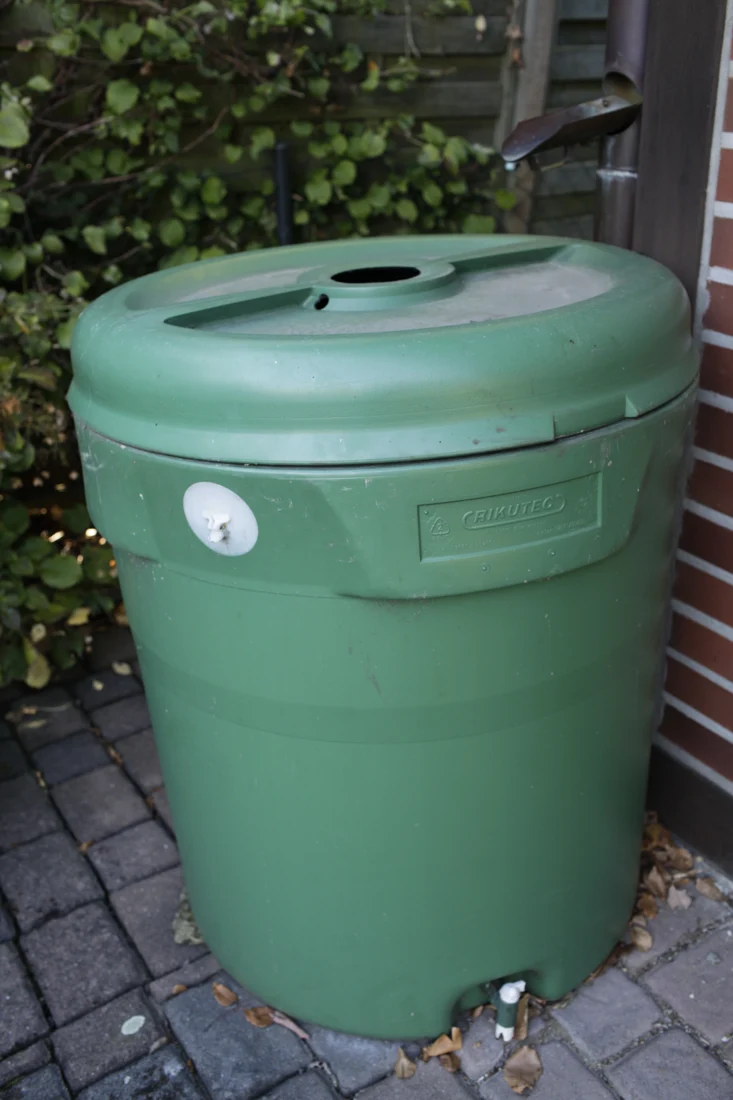
A rainwater container photographed in Germany in 2018. This international equipment reference illustrates the lid, collection arrangement and tap; the picture does not verify usable capacity, support, water quality or suitability for a U.S. property.
Ask: Which inlet screening, cover, usable volume, support assessment, outlet and overflow are documented for the actual model?
Photo source & use
Jeuwre / Wikimedia Commons. Source record · CC BY-SA 4.0. Resized and WebP encoded, orientation from metadata, no retouching. Checked 27 October 2026. Not a DLG project or a site-specific installation approval.
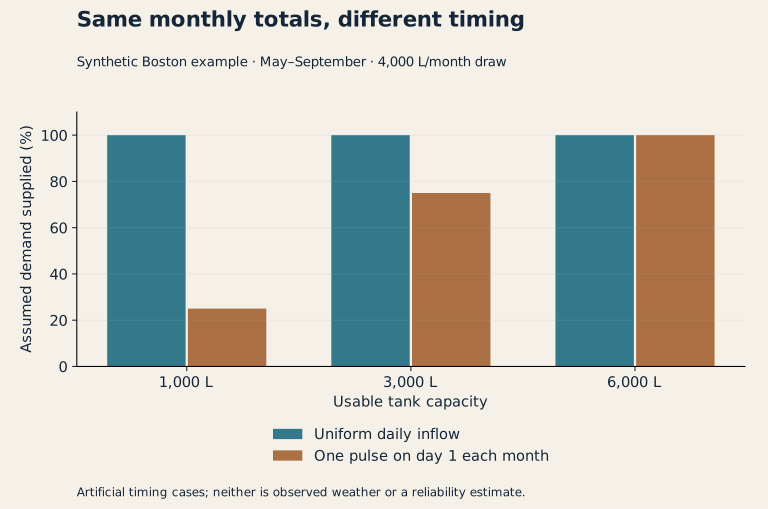
Here are two synthetic daily inflow patterns made from exactly the same monthly Boston totals:
Uniform daily: the month’s potential enters in equal portions every day.
First-day pulse: all the month’s potential enters on day one, followed by no inflow for the rest of that month.
Neither pattern is observed Boston weather, a weather-generator prediction or a statistically defined best/worst bound. The purpose is to expose how an invented timing assumption can change a storage result while monthly totals stay identical.
Both start with an empty tank on 1 May and use the same daily demand profile. Usable capacities are 1,000, 3,000 and 6,000 L; they are not nominal product sizes. Each daily step adds inflow, applies the capacity and spills excess, supplies demand, then carries the remainder forward. Evaporation, leaks, pump limits, dead storage and downtime are excluded.
Teaching example only. Percentages describe the share of this assumed 20,000 L demand supplied under two invented timing patterns; they are not measured collection efficiencies, reliability probabilities or tank-sizing recommendations.
Usable capacity
Uniform daily inflow: supplied
First-day pulse: supplied
First-day pulse: unmet
1,000 L
20,000 L
5,000 L
15,000 L
3,000 L
20,000 L
15,000 L
5,000 L
6,000 L
20,000 L
20,000 L
0 L
For example, the 1,000 L first-day-pulse case captures a maximum of 1,000 L for each month’s draw after immediate spill. Across five months it supplies 5,000 L and leaves 15,000 L unmet. The uniform case replenishes the same small tank daily and supplies all the assumed demand. That contrast comes from the input timing, not a change in roof efficiency.
The package includes all 18 combinations across three stations, three capacities and two artificial patterns, plus 2,754 daily balance rows. Identical demand-coverage outcomes in these particular patterns do not imply identical real-world regional reliability. Overflow and ending-storage records are retained instead of hiding unused water.
Calculation method and balance checks
For each day, with previous storage S, inflow Q, usable capacity C and draw D:
Overflow = max(0, S + Q − C).
Water before draw = min(C, S + Q).
Supplied = min(water before draw, D).
Ending storage = water before draw − supplied.
Unmet = D − supplied.
The check is S + Q = overflow + supplied + ending storage at every step. Seasonal initial storage plus inflow equals overflow plus supply plus final storage. May–September month lengths are 31, 30, 31, 31 and 30 days; no observed daily rainfall record is represented by those calendar lengths.
These explicit cases have no evaporation or treatment-tank water demand. The collection factor is applied only once, before the daily timing allocation. Full-precision values are used in the balance; tables round only for presentation.
6. Turn the comparison into a project brief
Request a contributing-roof plan, material and water-quality review, actual connected area, event-loss assumptions, proposed usable storage, seasonal operating plan and dated demand record. Confirm the overflow destination separately from the capacity comparison.
For reliability or a tank-selection decision, obtain a suitable multi-year daily or finer rainfall sequence, represent winter operation and dry spells, and match the draw profile to the actual intended use. A normal monthly average cannot show the longest dry interval, storm peaks or the water available on a particular day. It is also not the design rainfall for sizing an overflow pipe or site drainage system.
A useful next result would show the selected site’s supply, spill, unmet demand and operating constraints under a documented time series. The present module closes the seasonal reference comparison and reproducible arithmetic, while leaving site design and reliability analysis open.
7. Derive a demand assumption instead of borrowing a tank size
The earlier 4,000 L/month draw was intentionally arbitrary. A second, separate exercise shows how a demand estimate can begin: assume 100 m² of ornamental planting with a 15 mm net irrigation deficit over one week, after the designer has already considered effective rainfall and the soil/plant situation. Assume 0.85 delivery efficiency. Neither the deficit nor efficiency is measured or prescribed for the three regions.
Net water required = 100 m² × 15 mm = 1,500 L/week.
Water drawn from storage = 1,500 / 0.85 = 1,764.71 L/week.
Do not count rainfall twice by taking a deficit that already includes it and subtracting the same rain again. Do not use the roof’s 0.80 collection factor as the garden’s delivery efficiency; they describe different boundaries.
Usable stored water at the start
Weeks of the assumed draw with no refill
Approximate days at the assumed even daily draw
1,000 L
0.57
3.97
3,000 L
1.70
11.90
6,000 L
3.40
23.80
Four identical weeks would draw approximately 7,058.82 L, which is different from the earlier 4,000 L/month teaching case. Neither may be substituted into the old timing chart without rerunning it. A calendar month is not always four weeks. These duration ratios ignore changes in demand and all refills; they are not supply-reliability probabilities or a recommendation to buy one of these capacities.
State which losses your calculation actually includes
For a separate 10 mm event on the same connected 100 m² roof, the earlier aggregate factor gives 10 × 100 × 0.80 = 800 L of potential inflow. If the 0.80 factor was intended to include diversion/filter losses, subtracting a further generic loss for those same processes counts them twice. A more detailed event model must replace the aggregate assumption with explicitly defined roof, diversion and filter terms. It cannot simply stack an unexplained new deduction on top.
Record the system’s flow boundaries: roof precipitation → collected runoff → diverted/filtered volume → usable tank inflow → delivered ornamental water. Where no measurement exists, label the term as assumed. The source normals and a tank brochure alone cannot establish all five volumes.
03 / Follow equipment, overflow and recordsChapters 8–9 · Real equipment photographs, interfaces and operating evidence.
8. Resolve the full installation, including the water that is not stored
WORKED COMPARISON / INVENTED EVENTS
The same rain volume can arrive six times faster.
Keep the event calculator’s starting case: 100 m² connected horizontal roof, 25 mm total rain and a 0.80 collection factor. Both events below send an assumed 2,000 L to a tank with 1,000 L usable capacity, initially holding 600 L. There is no withdrawal during either event.
25 mm over 60 minutes
33.3 L/min
Equivalent constant tank inflow Assumed rain intensity: 25 mm/h
400 L headroom fills
12 min
Overflow continues for
48 min
Total overflow
1,600 L
60-minute event: first 20% fills the remaining space; next 80% overflows.
25 mm over 10 minutes
200 L/min
Equivalent constant tank inflow Assumed rain intensity: 150 mm/h
400 L headroom fills
2 min
Overflow continues for
8 min
Total overflow
1,600 L
10-minute event: first 20% fills the remaining space; next 80% overflows.
Each bar shows the fraction of its own event duration; the two bars do not share a time scale. Light = filling the 400 L headroom; dark = overflow. Inflow is assumed constant, with immediate routing and unrestricted overflow once full. Actual roof, gutter, diversion, inlet and outlet behaviour is not simulated.
Both balances: 600 L initial + 2,000 L inflow − 1,600 L overflow = 1,000 L final storage. The tank’s stored volume increases by 400 L.
What to ask: Which local design rainfall, connected area, inlet capacity and full-tank overflow route does the proposal use? Show where that water can go and how blockages or shutdown are handled. A tank’s volume alone cannot establish those answers.
These are invented arithmetic events, not measured Boston, Dulles or Atlanta storms, design intensities, return periods or pipe/pump sizing. The 0.80 factor is one simplified collection-loss allowance, not a hydraulic validation or a separate first-flush calculation. Monthly normals cannot establish a design flow rate. Download the comparison data (CSV).
University of Minnesota Extension identifies rain-barrel overflow, screening, maintenance and seasonal draining as important operating elements. Its guidance directs overflow away from buildings and describes reconnecting the downspout route when a barrel is removed for winter. [RW06] These are useful review principles, not a local permit determination for Boston, Fairfax or Atlanta or instructions to build an unverified platform.
ACTUAL PHOTOGRAPH / REFERENCE
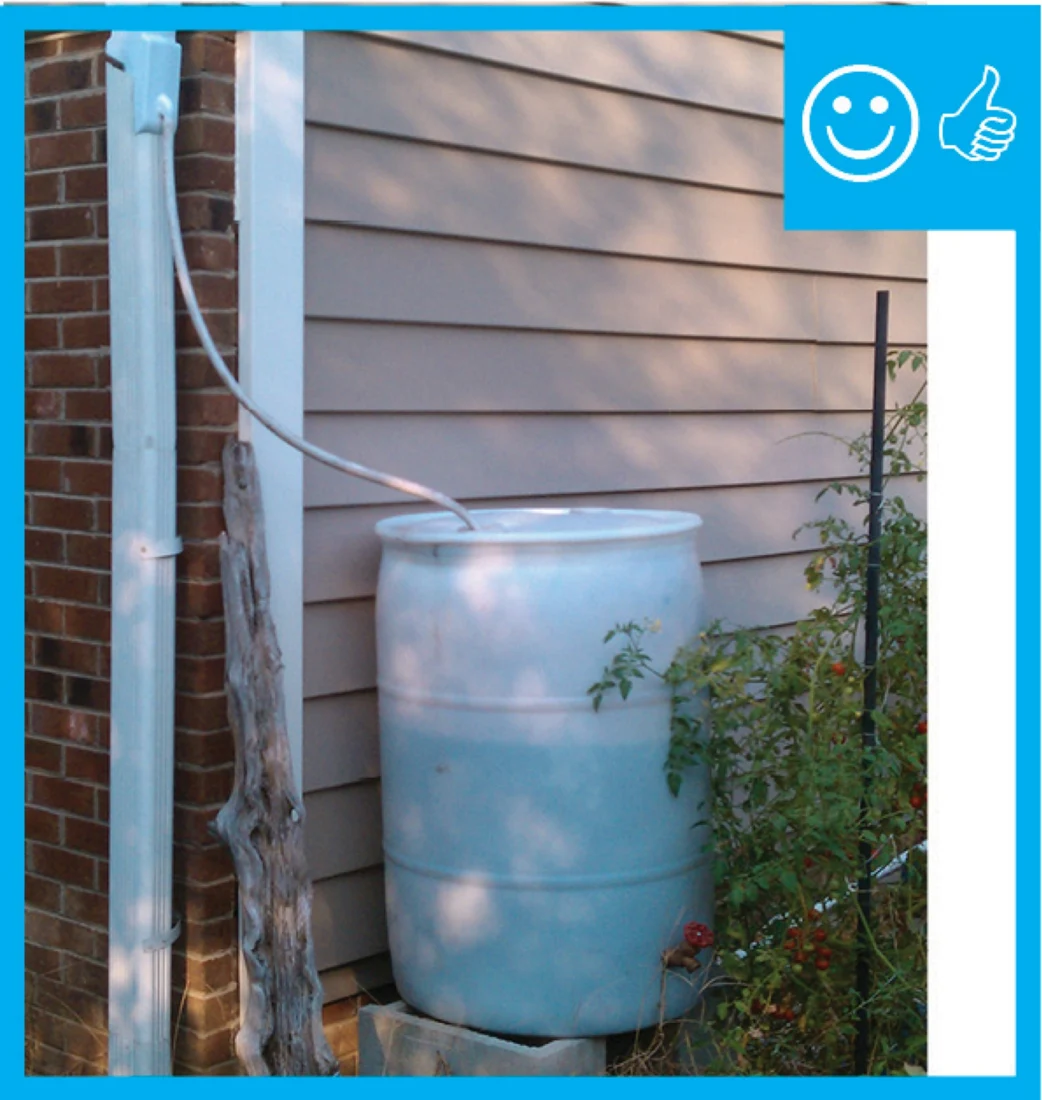
A full rain barrel still needs an overflow route
The source reference shows a barrel beside a house with an overflow connection. Its original labels belong to an EPA/ENERGY STAR guide. They do not establish the required dimensions, permitted discharge or full hydraulic design for another property.
Ask: Show the complete full-tank overflow route, receiving point, access and seasonal operating instructions in the proposal.
Photo source & use
EPA / ENERGY STAR / Courtesy of the U.S. Department of Energy. Source record · BASC reuse guidance. Resized and WebP encoded, orientation from metadata, no retouching. Checked 27 October 2026. Not a DLG project or a site-specific installation approval.
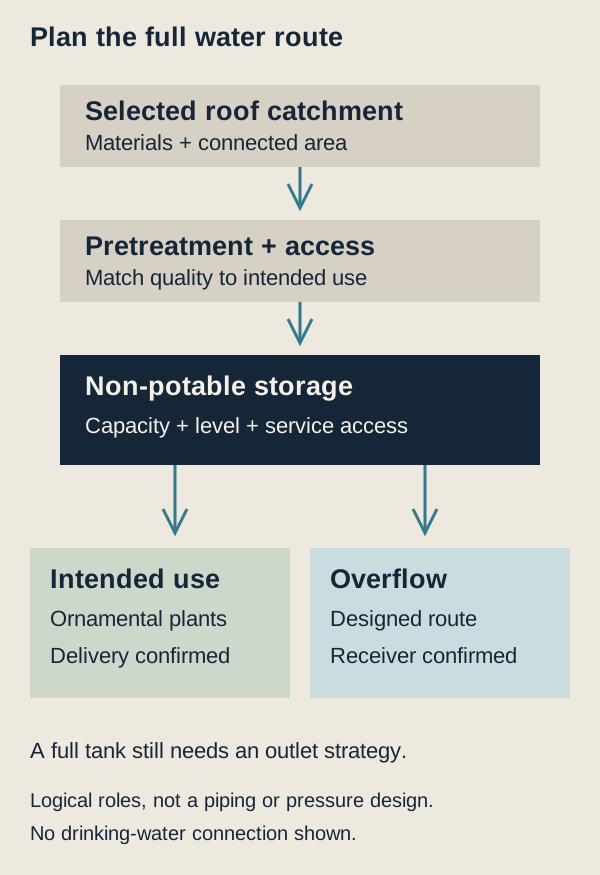
Original DLG role drawing from the landscape and water guide. It pairs with the real barrel photograph to distinguish visible equipment from the complete water route. No pipe size, treatment design, pressure or discharge approval is specified.
Interface
Information the actual proposal should show
Owner’s verification
Roof / downspout
Connected horizontal area, roofing/material suitability and accessible inlet
The quoted area is actually connected; unconnected roofs are excluded
Screening / diversion
Selected components, cleaning access and stated volume losses
Maintenance can be performed without dismantling the garden
Tank / support
Nominal versus usable volume, physical access, full-load support and anchoring where applicable
The selected support/location has been assessed; capacity is not a structural approval
Overflow / bypass
Receiving route for a full tank, blockages, winter removal and intense events
Water is not merely redirected toward the foundation, neighbour or an unresolved low point
Delivery
Gravity/pump assumptions, equipment operating needs and intended use
Specified outlets work under the actual head/flow conditions
Other water services
Appropriate separation and any applicable backflow/cross-connection requirements
A potable connection is not improvised by joining hoses
Winter / shutdown
Which components drain, remain in service or are removed
Roof drainage still has a functioning route during shutdown
For scale, 3,000 L of water has a mass of approximately 3,000 kg, before the tank, support and other loads. This physical illustration does not size a foundation, deck, stand or restraint. Specify the actual full condition and have the relevant support/site design assessed before installation. Nominal tank capacity is not the same as the model’s usable volume.
A supplier should also distinguish a small rain barrel from a larger cistern proposal: the storage, support, access, delivery and maintenance scope can differ. University of Maryland Extension discusses both conservation and practical use and cautions that a rain barrel or two generally will not create meaningful bill savings. [RW07] This guide therefore makes no automatic payback or rebate claim.
9. Compare the proposals and record operating evidence
Request the same catchment, intended use and water balance in each offer. Separate equipment, site/support works, downspout modifications, overflow route, pump/power if included, commissioning, seasonal work and maintenance. A tank-only price does not cover the installed system. Identify which local approval checks and specialist assessments are included, by whom, and which remain owner responsibilities.
At handover, retain the actual roof connection plan, component identification, usable-volume basis, maintenance and winter instructions, observed inlet/overflow/delivery checks and the approved scope/closeout records applicable to the project. A full tank on the first day is not a season-long performance test.
For a first operating season, record dates, rainfall source, beginning/ending levels, draw or meter readings, overflow observations, downtime and supplemental water. Distinguish measured volumes from estimates: a wet patch is not a calibrated spill measurement. Use these observations to refine the model and maintenance plan rather than retrofit a success claim to the monthly-normal chart.
The existing use boundary remains non-potable ornamental planning. Minnesota Extension explains that roof collection can contain biological and material contaminants and recommends minimizing risk by keeping this water to suitable ornamental uses. [RW06] No edible-herb, potable-water or cross-connection approval is created by this example.
Sources, calculations and review dates
This companion uses three named NOAA/NCEI reference stations for the Greater Boston, Northern Virginia and Atlanta research areas. It separates published climate data from DLG arithmetic and deliberately artificial storage examples. It is not a forecast, a regional rainfall map or an installed-system performance estimate.
Monthly precipitation can help compare seasonal collection opportunities. The water available when a garden needs it also depends on the connected roof, losses, storage, rainfall timing and the intended use.
Sources, evidence and review
Focused recheck · 28 October 2026: all three NOAA monthly station CSVs were retrieved again; their bytes and 36 precipitation records match the retained files. Re-running the retained model reproduced all 36 monthly collection rows, 18 storage scenarios and 2,754 daily balance rows. This confirms reproduction, not site-specific rainfall or reliability. NOAA’s normals overview identifies 1991–2020 as the current conventional period; an airport reference is not a whole-state average or a property forecast.
Separate the drainage roles: PNNL’s Footing Drain Pipe guide describes drainage around foundations and an appropriate receiving route. It does not make a tank overflow connection to a footing drain appropriate for another site. Confirm surface, roof and foundation-water routes together with the responsible designer and authority; historical code examples in that guide are not asserted as current local rules.
Keep the intended use explicit: CDC’s rainwater health overview (23 July 2024; rechecked 28 October 2026) supports the retained non-potable ornamental-use boundary and separation from piped drinking water. Visual clarity does not establish water quality. Neither the new event comparison nor collection arithmetic specifies treatment.
Source access and calculations checked 20 October 2026. Original station CSVs, NOAA summary PDFs, CSV/PDF cross-check, flags, calculation inputs, derived CSVs and reproduction script are included in the web package. Both charts are original DLG plots; NOAA source artwork and logos are not reused.
RW01 — NOAA/NCEI, monthly normals documentation:Monthly product definitions. Variable and completeness interpretation; source units independently confirmed on each station’s PDF.
All 36 precipitation cells are present and flagged S (standard). The CSV reports 29 contributing years for Boston August and 30 for the other 35 cells. Standard does not mean every cell contains 30 direct monthly observations; NOAA’s documented normal-building rules can include estimation. Source hashes identify the exact snapshots used.
The word “potential” and the synthetic timing labels must remain with any future post, Story or chart crop. Use this reading alongside the related DLG water guides.
RW06 — University of Minnesota Extension:Rain barrels in the home landscape, reviewed 2024; accessed 20 October 2026. Non-potable use, overflow and winter/maintenance principles; not local approvals for the three research regions.
RW07 — University of Maryland Extension:Harvesting Rainwater with Rain Barrels, FS-2025-0769, updated 10 March 2026; accessed 20 October 2026. Barrel/cistern and conservation/cost context only; Maryland legal statements are not transferred to MA/VA/GA.
Depth checkpoint: original retained NOAA snapshots and 36 monthly cells, 18 synthetic cases and 2,754 daily balances rechecked by rerunning the provided calculator in an isolated copy. No new NOAA vintage or observed daily-rainfall sequence is claimed. New demand, duration and full-water-mass examples have their own labelled assumptions.
Water-Smart Homes
How Rainwater Harvesting Works
Rainwater harvesting connects a collection surface to storage and a planned use. For a home, the journey often starts with a roof, gutters and downspouts. Roof materials, surrounding trees and maintenance affect what enters the system.
Screens and prefilters remove larger debris. A first-flush arrangement diverts an initial portion of runoff before the remaining flow enters storage. These steps do not, by themselves, make water safe to drink. Treatment must match the intended use and applicable requirements.
A covered tank stores water between rainfall and demand. A screened overflow needs a planned discharge route. Water may then reach an irrigation zone by gravity or a pump, depending on elevation, equipment and pressure requirements.
Think about the complete route: collection, diversion, storage, delivery and overflow. Include access for cleaning and a seasonal operating plan. Before choosing equipment, ask: where will excess water go, and what happens when the tank is empty?
Storage Systems & Materials
Rain barrels, freestanding cisterns, slim tanks and underground storage solve different space and capacity problems. Compare usable volume, service access and installation requirements before comparing appearance.
Polyethylene tanks can suit some aboveground applications. Material formulation, intended use, UV exposure and support requirements matter. Steel systems may use protective coatings or liners; their condition and compatibility need review. Concrete tanks introduce different structural, access and water-chemistry considerations. A tank designed for aboveground use should never be assumed suitable for burial.
Underground storage frees surface space but introduces excavation, groundwater, access and potential buoyancy issues. A slim tank may fit a narrow area while requiring careful stability and foundation design. Linked modules add joints, valves and maintenance points.
Request documentation for the actual model and use. Check access for sediment removal, insect protection, overflow arrangements and winter operation. Nominal capacity is only one comparison: a system also needs to fit the site, remain serviceable and meet the relevant requirements.
Before comparing prices, ask what the complete installed system includes beyond the tank.
Rainwater Harvesting Walls
Could water storage become part of the landscape design? A rainwater storage wall arranges tanks or purpose-designed modules along a boundary, screen or garden feature. The idea is to integrate storage with architecture while keeping the water system accessible.
A storage wall is not automatically a structural wall, retaining wall, fence or approved property boundary. Its support, connections and use need separate review. Water is heavy: one liter has a mass of approximately one kilogram. The filled system, not just the empty shell, determines important design loads.
Ask how individual sections connect, isolate, drain and receive maintenance. Consider leakage, movement, wind exposure, freezing and the route for overflow. A slim appearance does not remove foundation or anchoring requirements.
Compare this approach with a conventional cistern, a rain barrel or underground storage. The best fit depends on the property and its intended use.
DLG's illustration is an original educational concept. It does not depict a product offered, installed or endorsed by DLG.
Rainwater for Landscape Irrigation
Stored rainwater may supply selected landscape uses when the system is designed for that purpose. Start with plant needs, soil, irrigation zones and seasonal demand. A garden's water demand does not necessarily occur when rain arrives.
Drip or subsurface delivery may reduce direct contact compared with accessible spray, but still needs suitable filtration, pressure and maintenance. Check emitter requirements and plan how irrigation stops when storage is low. Any potable backup must have the required separation and backflow protection.
In Virginia, the rainwater regulations distinguish surface or subsurface irrigation from uses such as hose bibs and unrestricted spray. Do not assume every garden connection has the same requirements.
Keep overflow away from locations where it could damage the home or neighboring property. Plan cleaning and a freeze-season shutdown or other documented winter strategy appropriate to the equipment and site.
Before using collected water on edible crops, investigate crop-contact and local guidance. A roof-to-garden diagram explains a principle; it is not permission to connect any tank to any irrigation system.
Smart Monitoring & Automation
A water-smart home needs useful information as well as storage. A level sensor can show how much water remains. Flow readings may help identify unexpected use. Pump controls can stop operation at low water levels, while weather or soil-moisture information can help decide when irrigation is needed.
These functions solve different problems. A tank-level sensor does not establish water quality, and a weather forecast does not guarantee rainfall at your home. The controller should match the actual irrigation equipment and water supply.
Plan for sensor faults, a lost internet connection and power interruptions. Useful features include local controls, understandable alerts and a documented safe fallback. Track maintenance rather than assuming automation removes it.
WaterSense-labeled irrigation controller categories include weather-based and soil-moisture-based approaches. Suitability for a rainwater-fed system requires a separate compatibility check.
The practical question: can you understand what the system is doing, intervene when needed and keep it maintained over time?
Massachusetts & Virginia Considerations
The same storage concept can require different local decisions.
In Massachusetts, use the state plumbing code and the local authority as starting points. The state's published plumbing definition includes piping to rainwater retention or greywater recovery within its scope, while distinguishing certain exterior gutter and downspout piping. That distinction does not establish blanket approval for a complete system. Confirm the actual arrangement, permits and licensed work with the appropriate authority.
In Virginia, check whether Chapter 635 applies to the proposed system. The applicability section contains exclusions, including certain individual rain barrels used solely for Tier 1 end uses. End-use tiers distinguish low-exposure irrigation from higher-contact uses. For covered Tier 1–3 systems, the rule does not require the Chapter 635 construction permit but requires registration within 30 calendar days of installation; other local requirements still need review.
In either state, investigate freeze protection, access, drainage, setbacks, structural support and any potable-water connection. This overview is not a property-specific approval.
Rainwater Collection Calculator
How much water could your roof collect? Start with the horizontal roof area draining to the system, rainfall for the same period and an explicitly stated collection efficiency.
For US customary units:
Potential collection in gallons = roof area in square feet × rainfall in inches × 0.623376 × collection efficiency.
For metric units:
Potential collection in liters = roof area in square meters × rainfall in millimeters × collection efficiency.
This estimates inflow, not guaranteed usable water or the right tank size. A tank can overflow during storms and run empty between them. Demand, timing, losses and seasonal operation change what is actually delivered.
For an illustrative scenario, 1,000 square feet, one inch of rain and an assumed 80% efficiency give about 499 gallons of potential collection. An empty 200-gallon tank with no use during that event would retain 200 gallons and overflow about 299 gallons.
Use location-specific rainfall information with its station and date range. Historical climate normals describe past averages, not a forecast or guaranteed supply. Compare scenarios before making equipment decisions.
Questions to ask the provider
Which roof area actually connects to this system, and how was it measured?
What is the usable volume, and how does it differ from nominal capacity?
Which intended uses are included, and what evidence supports the treatment selected?
What supports the filled system, and who is responsible for reviewing that support?
Where do first-flush discharge, tank overflow and winter bypass go?
Which components need cleaning, draining, replacement or specialist service?
How does delivery stop at low water level, and what happens during a power or control failure?
Which permits, registration or inspections apply to this particular arrangement, and who handles them?
What is included in commissioning and the owner's handover file?
What do the warranty and service arrangements exclude?
Estimate potential collection
Estimate potential inflow. Enter a tank capacity to see an illustrative split between storage and overflow. Use connected horizontal roof area and rainfall for the same period. Historical regional snapshots and the water-balance examples remain separate.
80% is an editable example, not measured local performance. Note the rainfall source and period. Snow equivalent is not immediately available liquid water. Storage, demand and timing require the existing balance analysis.