
Market perspectives
Place matters.
So does the period.
Sales reports, asking rents and national mortgage benchmarks answer different questions. We keep their coverage and dates separate.
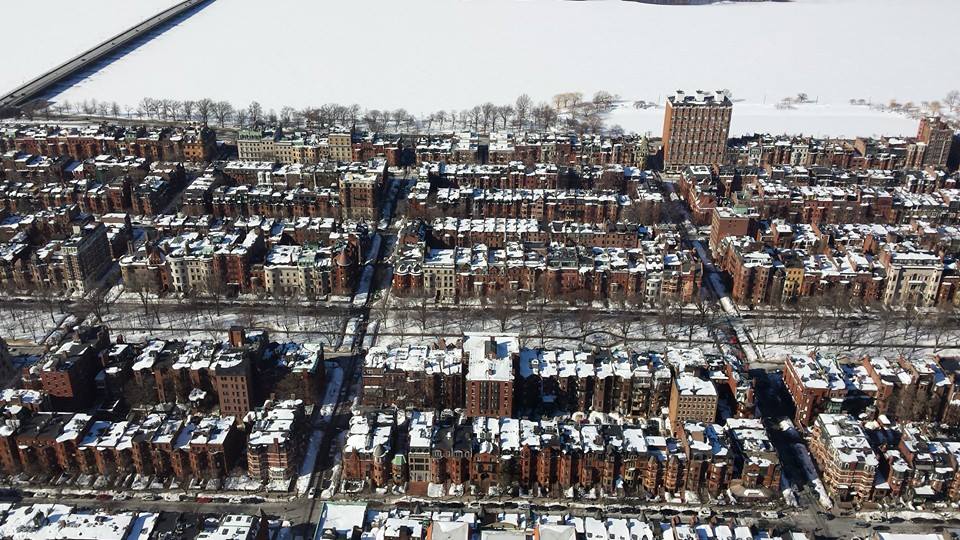




Greater Boston
Scope-aware reading. A research geography, not a current DLG office or service territory.
Northern Virginia
Scope-aware reading. A research geography, not a current DLG office or service territory.
Atlanta
Scope-aware reading. A research geography, not a current DLG office or service territory.
Mortgage rates: national context, local decisions.
Explore the shared historical national chart and monthly data table. Regional sales and rental coverage remain separate.
Explore U.S. mortgage context ↗Before using a market number, read its evidence passport.
A number becomes useful when its area, property group, measurement and period match the decision. Start with those four fields before comparing two reports.
| Field | What to record | A mismatch to resolve |
|---|---|---|
| Place | Named source area, geography level and boundary vintage | A metro rent series presented as one county or as a loosely named research region |
| Homes | All homes, detached, condo/townhome or another exact source group | A change in the property mix interpreted as the price movement of the same house |
| Measure | Asking/observed rent, signed rent, closed sale, pending sale, inventory or rate benchmark | Listed rents used directly as a property’s achievable lease or underwriting input |
| Time | Reference period, comparison period and retrieval date separately | A release date read as the measured month, or a comparison label silently corrected |
| Use | Source attribution and the documented scope for reusing numbers or graphics | An accessible chart treated as permission to reproduce all its artwork/data |
Zillow describes ZORI as a smoothed, stock-weighted measure of observed market rent. It is useful context; it is not a signed lease for the property being analysed. Zillow’s metric definitions were checked21October2026.
Keep the DLG research label separate from the source area.
The retained rent references use the source rows Boston, MA; Washington, DC; and Atlanta, GA. Their metro labels do not establish a match to GBAR’s sales footprint, NVAR’s reporting footprint, the Atlanta sales brief or a selected county. In particular, Washington metro context must not be relabelled Northern Virginia-only rent. The exact source-series boundary crosswalk remains open.
Resolve a comparison label with companion evidence.
Focused recheck · 28 October 2026: the NVAR article still labels its pending-sales annual comparison against the same month/year. Its linked official regional infographic explicitly compares September 2026 with September 2025 and reports 1,204 pending sales, down 16.2%. That companion evidence reconciles the comparison period for this row; it does not correct the article itself. The source region excludes separately reported Loudoun County. Full-series publication and source-artwork reuse remain separate decisions; no source infographic is reproduced here.
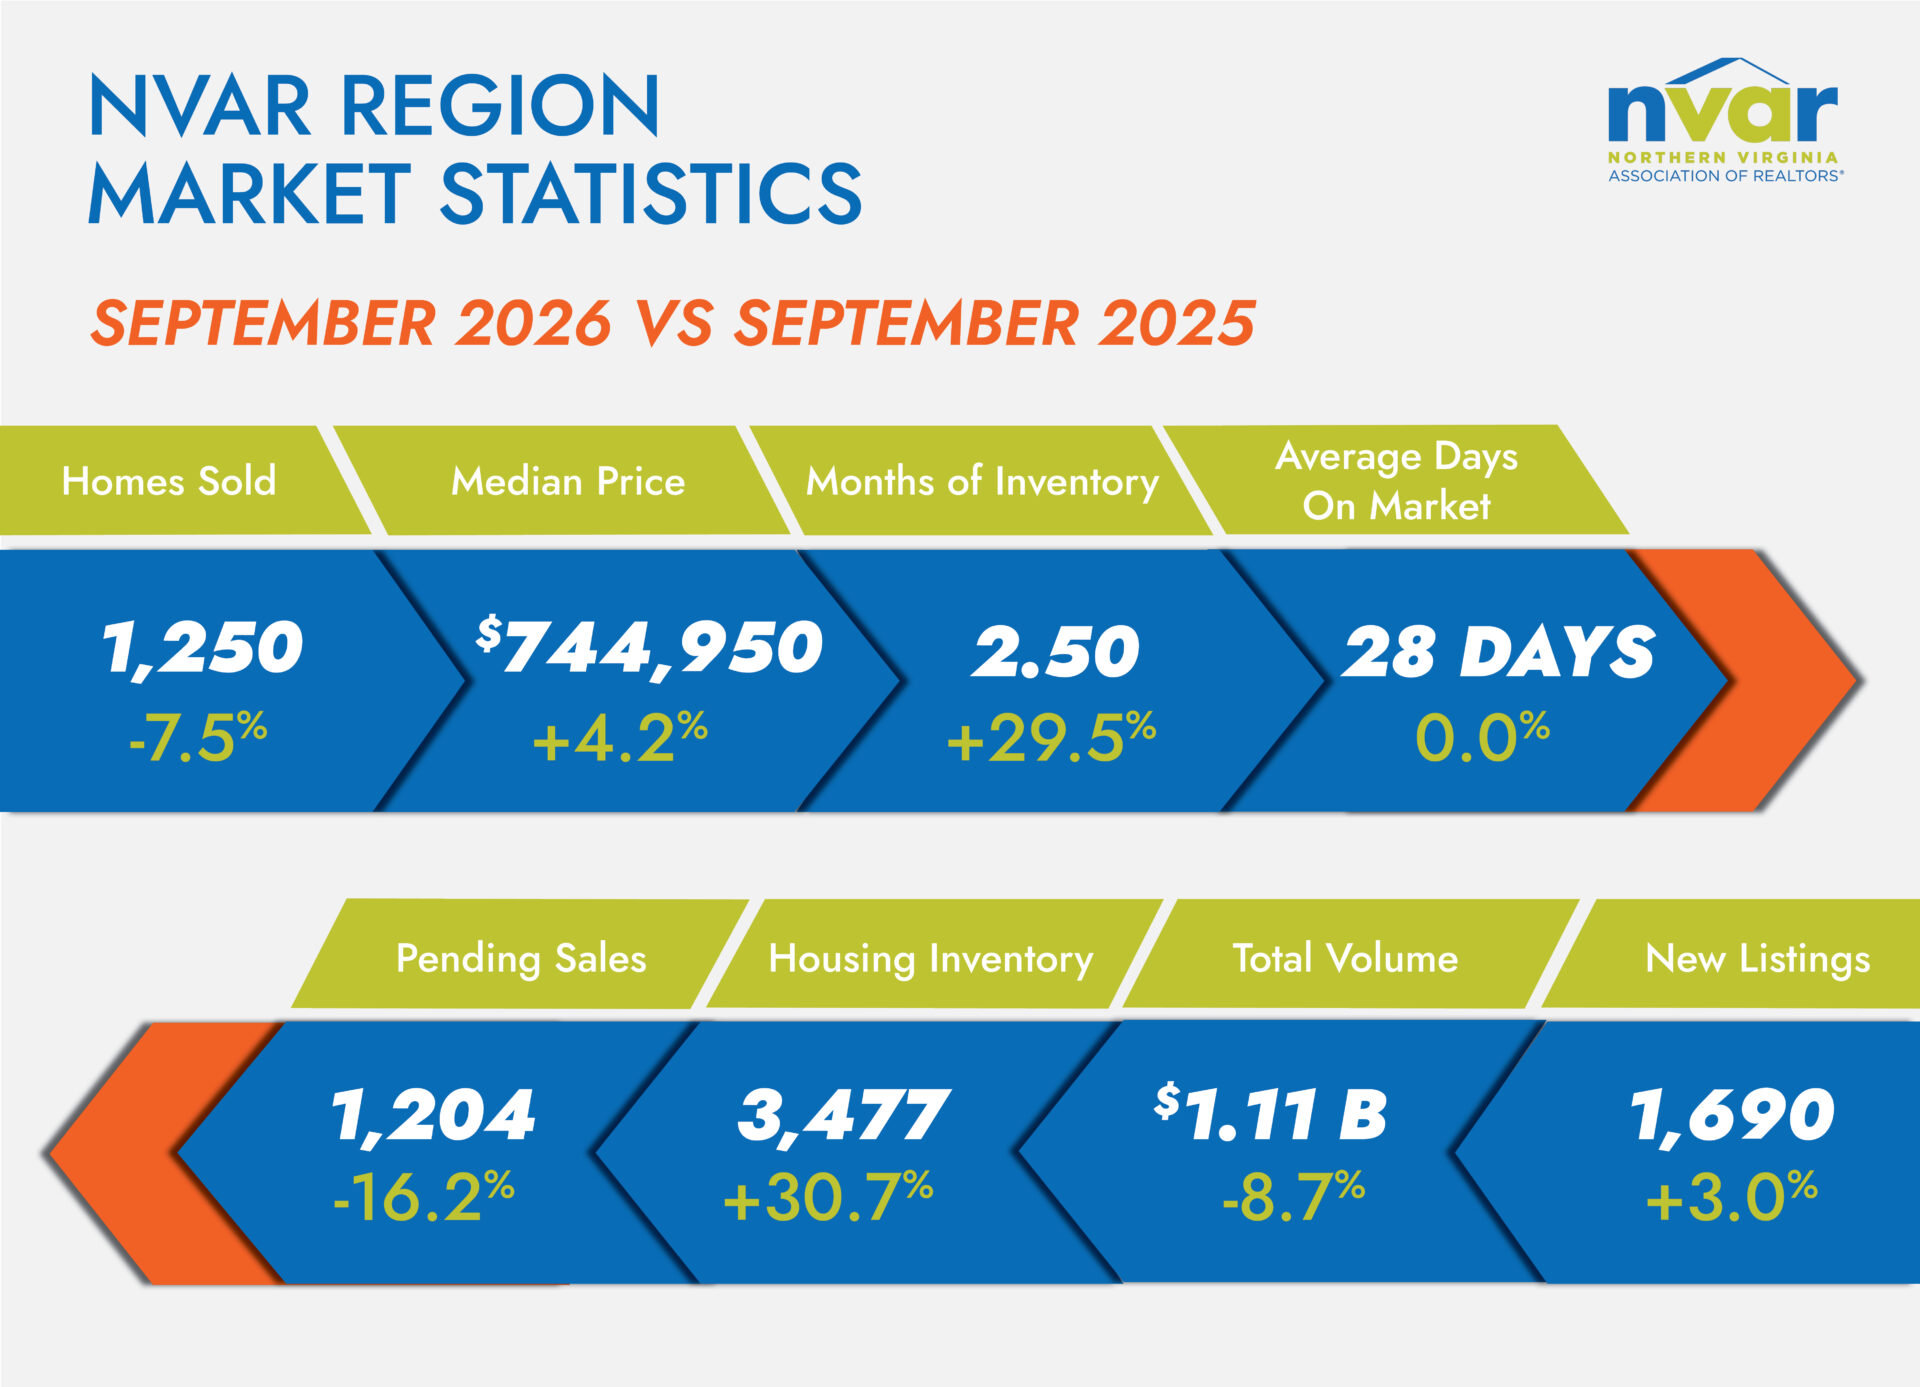
Read the retained panels as separate evidence sets. This comparison describes the historical source material reviewed for these guides. It is not a new numerical-data intake or a declaration that the latest available month has been loaded.
| DLG reading route | Retained source row | Measurement and period | Comparison limit |
|---|---|---|---|
| Greater Boston rental panel | Boston, MA · Zillow RegionID394404 | ZORI, smoothed all homes plus multifamily; Sep2025–Aug2026 displayed; intake checked11Oct2026 | Metro context; exact boundary match to the sales-report footprint remains unverified |
| Northern Virginia rental context | Washington, DC · Zillow RegionID395209 | Same retained metric and displayed months; intake checked11Oct2026 | Washington metro row, not Northern Virginia-only or a selected county |
| Atlanta rental panel | Atlanta, GA · Zillow RegionID394347 | Same retained metric and displayed months; intake checked11Oct2026 | Metro rental row; do not assume it matches the eleven-county sales brief |
| NVAR September sales report | Association reporting footprint; Loudoun reported separately | September2026 activity; article released16Oct2026; stated MLS data as of12Oct2026 | Sales activity is a different measure and period from the retained August rent endpoint |
What the new source check establishes. On30October2026, Zillow’s data page still described ZORI as a smoothed, rental-stock-weighted repeat-rent index and offered distinct property-group and adjustment variants. NVAR’s article still identified its reporting footprint and separately discussed Loudoun. The article’s pending-sales comparison-label error remained present. The previously reviewed companion evidence is retained; it was not freshly downloaded in this check.
Before comparing or updating: retain the exact series ID, geography, property group, adjustment method, reference month and retrieval vintage. A definition check does not refresh the observations. A matching metro label does not complete the county crosswalk. For a property decision, add local comparable evidence rather than using the metro index as an achievable lease quote.
A practical buying question: “Which source row, property group and period supports this assumption—and what property-specific evidence changes it?” Keep those answers with the property analysis rather than turning a broad market index into an automatic rent, price or return promise.
Editorial reading framework, updated21October2026. Definitions: Zillow Research. Area context: U.S. Census Bureau glossary. Comparison-label check: NVAR September2026 report. No held numerical series or source artwork is reproduced here.